
一、ELK简介
ELK是三个开源软件的缩写,分别为:Elasticsearch 、 Logstash以及Kibana , 它们都是开源软件。不过现在还新增了一个Beats,它是一个轻量级的日志收集处理工具(Agent),Beats占用资源少,适合于在各个服务器上搜集日志后传输给Logstash,官方也推荐此工具,目前由于原本的ELK Stack成员中加入了 Beats 工具所以已改名为Elastic Stack。
Elastic Stack包含:
Elasticsearch是个开源分布式搜索引擎,提供搜集、分析、存储数据三大功能。它的特点有:分布式,零配置,自动发现,索引自动分片,索引副本机制,restful风格接口,多数据源,自动搜索负载等。
详细可参考Elasticsearch权威指南
Logstash 主要是用来日志的搜集、分析、过滤日志的工具,支持大量的数据获取方式。一般工作方式为c/s架构,client端安装在需要收集日志的主机上,server端负责将收到的各节点日志进行过滤、修改等操作在一并发往elasticsearch上去。
Kibana 也是一个开源和免费的工具,Kibana可以为 Logstash 和 ElasticSearch 提供的日志分析友好的 Web 界面,可以帮助汇总、分析和搜索重要数据日志。
Beats在这里是一个轻量级日志采集器,其实Beats家族有6个成员,早期的ELK架构中使用Logstash收集、解析日志,但是Logstash对内存、cpu、io等资源消耗比较高。相比 Logstash,Beats所占系统的CPU和内存几乎可以忽略不计
ELK Stack (5.0版本之后)--> Elastic Stack == (ELK Stack + Beats)。目前Beats包含六种工具:
Packetbeat: 网络数据(收集网络流量数据)
Metricbeat: 指标 (收集系统、进程和文件系统级别的 CPU 和内存使用情况等数据)
Filebeat: 日志文件(收集文件数据)
Winlogbeat: windows事件日志(收集 Windows 事件日志数据)
Auditbeat:审计数据 (收集审计日志)
Heartbeat:运行时间监控 (收集系统运行时的数据)
ELK官网:https://www.elastic.co/cn/
中文指南:https://www.gitbook.com/book/chenryn/elk-stack-guide-cn/details
1、环境准备
操作系统:CentOS Linux release 7.4.1708 (Core)
服务器IP:192.168.8.25
2、软件版本
elasticsearch:elasticsearch-6.4.0.tar.gz
kibana:kibana-6.4.0-linux-x86_64.tar.gz
logstash:logstash-6.4.0.tar.gz
filebeat:filebeat-6.4.0-linux-x86_64.tar.gz
JDK:JDK-1.8.0_181
二、基础环境配置及软件包下载
1、关闭防火墙和selinux
[root@localhost ~]# systemctl stop firewalld
[root@localhost ~]# systemctl disable firewalld
[root@localhost ~]# setenforce 0
[root@localhost ~]# sed -i '/SELINUX/s/enforcing/disabled/' /etc/selinux/config
2、内核优化
[root@localhost ~]# vim /etc/security/limits.conf
# 在文件最后添加以下内容
* soft nofile 65537
* hard nofile 65537
* soft nproc 65537
* hard nproc 65537
* soft nproc 4096
[root@localhost ~]# vim /etc/sysctl.conf
# 添加以下内容
vm.max_map_count = 262144
net.core.somaxconn=65535
net.ipv4.ip_forward = 1
# 执行sysctl -p使其生效
[root@localhost ~]# sysctl –p
3、安装JDK环境
[root@localhost ~]# wget https://mirrors.yangxingzhen.com/jdk/jdk-8u181-linux-x64.tar.gz
[root@localhost ~]# tar zxf jdk-8u181-linux-x64.tar.gz -C /usr/local
# 配置/etc/profile,添加以下内容
[root@localhost ~]# vim /etc/profile
export JAVA_HOME=/usr/local/jdk1.8.0_181
export CLASSPATH=$CLASSPATH:$JAVA_HOME/lib:$JAVA_HOME/jre/lib
export PATH=$JAVA_HOME/bin:$JAVA_HOME/jre/bin:$PATH:$HOMR/bin
[root@localhost ~]# source /etc/profile
# 看到如下信息,java环境配置成功
[root@localhost ~]# java -version
java version "1.8.0_181"
Java(TM) SE Runtime Environment (build 1.8.0_181-b13)
Java HotSpot(TM) 64-Bit Server VM (build 25.181-b13, mixed mode)
三、安装elasticsearch
1、创建持久化目录及Logs日志目录
[root@localhost ~]# mkdir -p /data/elasticsearch/{data,logs}
2、下载elasticsearch软件包
[root@localhost ~]# wget https://artifacts.elastic.co/downloads/elasticsearch/elasticsearch-6.4.0.tar.gz
3、解压并重命名
[root@localhost ~]# tar zxf elasticsearch-6.4.0.tar.gz
[root@localhost ~]# mv elasticsearch-6.4.0 /usr/local/elasticsearch
4、修改elasticsearch.yml配置文件,文件内容如下
[root@localhost ~]# vim /usr/local/elasticsearch/config/elasticsearch.yml
node.name: localhost
path.data: /data/elasticsearch/data
path.logs: /data/elasticsearch/logs
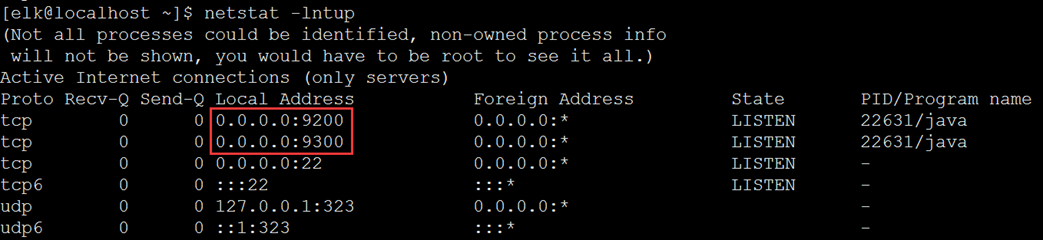
network.host: 0.0.0.0
http.port: 9200
5、创建elk用户并授权
[root@localhost ~]# useradd elk
[root@localhost ~]# chown -R elk.elk /usr/local/elasticsearch/
[root@localhost ~]# chown -R elk.elk /data/elasticsearch/*
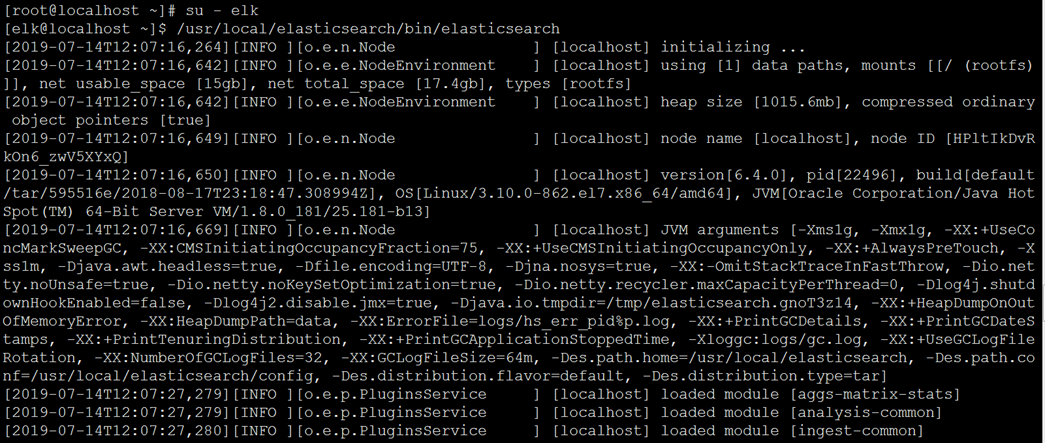
6、启动es服务(第一次先测试好在加-d后台启动)
[root@localhost ~]# su - elk
[elk@localhost ~]$ /usr/local/elasticsearch/bin/elasticsearch
7、后台启动es服务
[elk@localhost ~]$ /usr/local/elasticsearch/bin/elasticsearch -d
Elasticsearch常用命令
curl -XDELETE 'http://host.IP.address:9200/logstash-*' 删除索引(后面为索引名称)
curl -XGET 'host.IP.address:9200/_cat/health?v&pretty' 查看集群状态
curl -XGET 'host.IP.address:9200/_cat/indices?v&pretty' 查看索引
四、安装logstash
1、下载软件包
[root@localhost ~]# wget https://artifacts.elastic.co/downloads/logstash/logstash-6.4.0.tar.gz
2、解压并重命名
[root@localhost ~]# tar zxf logstash-6.4.0.tar.gz
[root@localhost ~]# mv logstash-6.4.0 /usr/local/logstash
3、编辑logstash.yml配置文件,添加以下内容
[root@localhost ~]# vim /usr/local/logstash/config/logstash.yml
config.reload.automatic: true
config.reload.interval: 10s
input {
    beats {
        host => "0.0.0.0"
        port => 5044
    }
}

output {
    stdout {
        codec => rubydebug
    }
    elasticsearch {
        hosts => ["192.168.8.25:9200"]
        index => "nginx_access-%{+YYYY.MM.dd}"
    }
}
5、启动logstash服务
[root@localhost ~]# chown -R elk.elk /usr/local/logstash
[root@localhost ~]# su - elk
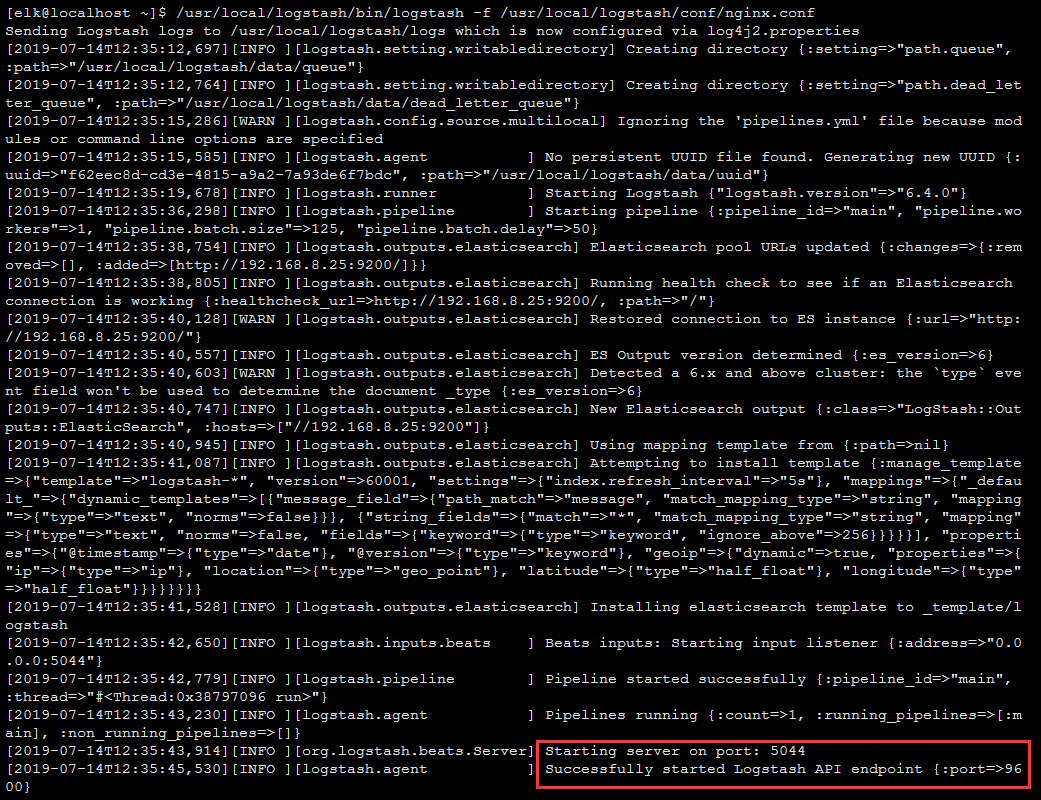
# 前台启动
[elk@localhost ~]$ /usr/local/logstash/bin/logstash -f /usr/local/logstash/conf/nginx.conf
# 后台启动
[elk@localhost ~]$ nohup /usr/local/logstash/bin/logstash -f /usr/local/logstash/conf/nginx.conf &
五、安装filebeat
1、下载filebeat软件包
[root@localhost ~]# wget -c https://artifacts.elastic.co/downloads/beats/filebeat/filebeat-6.4.0-linux-x86_64.tar.gz
2、解压并重命名
[root@localhost ~]# tar zxf filebeat-6.4.0-linux-x86_64.tar.gz
[root@localhost ~]# mv filebeat-6.4.0-linux-x86_64 /usr/local/filebeat
[root@localhost ~]# chown -R elk.elk /usr/local/filebeat/
3、编辑filebeat.yml配置文件,配置内容如下
[root@localhost ~]# vim /usr/local/filebeat/filebeat.yml
filebeat.inputs:
- type: log
  enabled: true
  paths:
    - /usr/local/nginx/logs/*.log
  fields:
    service: localhost
    log_type: log
    server_id: 127.0.0.1
  scan_frequerncy: 60
  multiline.pattern: ^\{4}
  multiline.negate: true
  multiline.match: after
filebeat.config.modules:
  path: ${path.config}/modules.d/*.yml
  reload.enabled: false
setup.template.settings:
  index.number_of_shards: 3
setup.kibana:
output.elasticsearch:
  hosts: ["192.168.8.25:9200"]
4、启动filebeat服务
[root@localhost filebeat]# su - elk
[elk@localhost filebeat]# cd /usr/local/filebeat
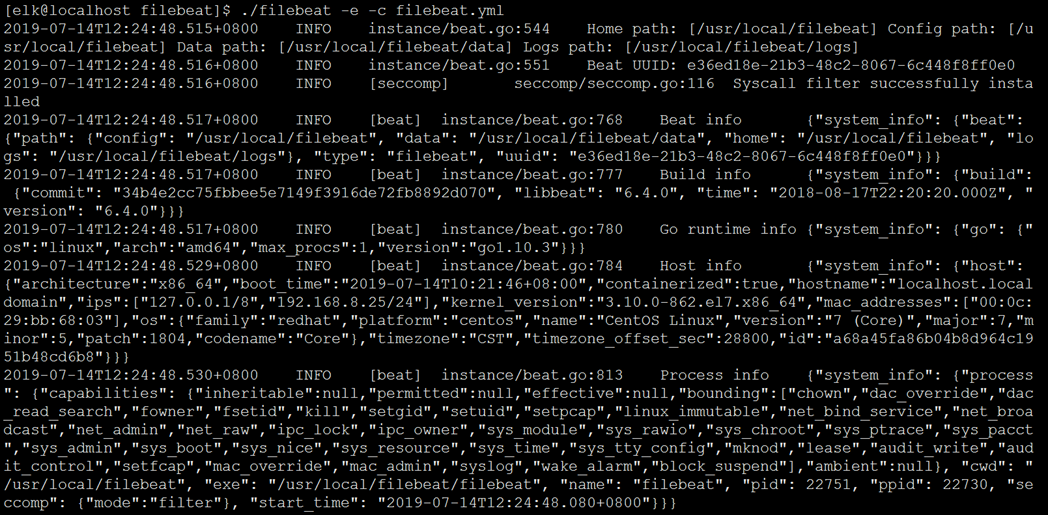
# 前台启动
[elk@localhost filebeat]$ ./filebeat -e -c filebeat.yml
# 后台启动
[elk@localhost filebeat]$ nohup ./filebeat -e -c filebeat.yml &
六、安装Kibana
1、下载Kibana软件包
[root@localhost ~]# wget https://artifacts.elastic.co/downloads/kibana/kibana-6.4.0-linux-x86_64.tar.gz
2、解压并重命名
[root@localhost ~]# tar zxf kibana-6.4.0-linux-x86_64.tar.gz
[root@localhost ~]# mv kibana-6.4.0-linux-x86_64 /usr/local/kibana
[root@localhost ~]# chown -R elk.elk /usr/local/kibana
3、编辑kibana.yml配置文件
[root@localhost ~]# vim /usr/local/kibana/config/kibana.yml
server.port: 5601
server.host: "192.168.8.25"
server.name: "XiaoQi-kibana"
elasticsearch.url: "http://192.168.8.25:9200"
kibana.index: ".kibana6"
4、启动Kibana服务
[root@localhost ~]# su - elk
# 前台启动
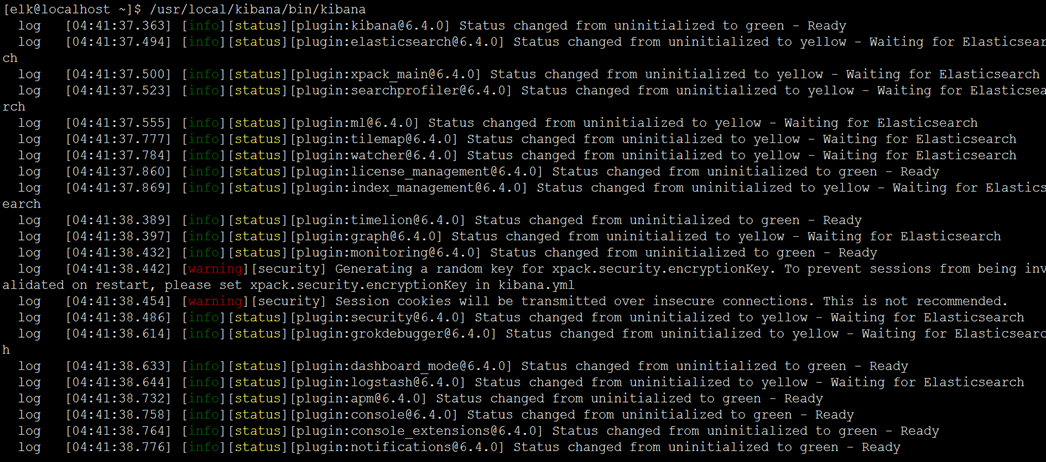
[elk@localhost ~]$ /usr/local/kibana/bin/kibana
# 后台启动
[elk@localhost ~]$ /usr/local/kibana/bin/kibana &
温馨提示:可以先前台启动查看日志,正常之后在后台启动。
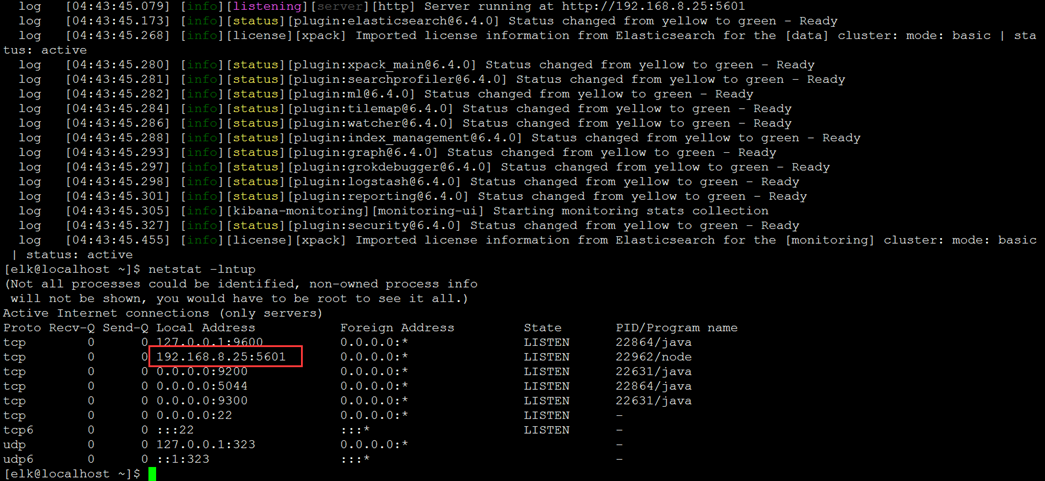
5、访问Kibana
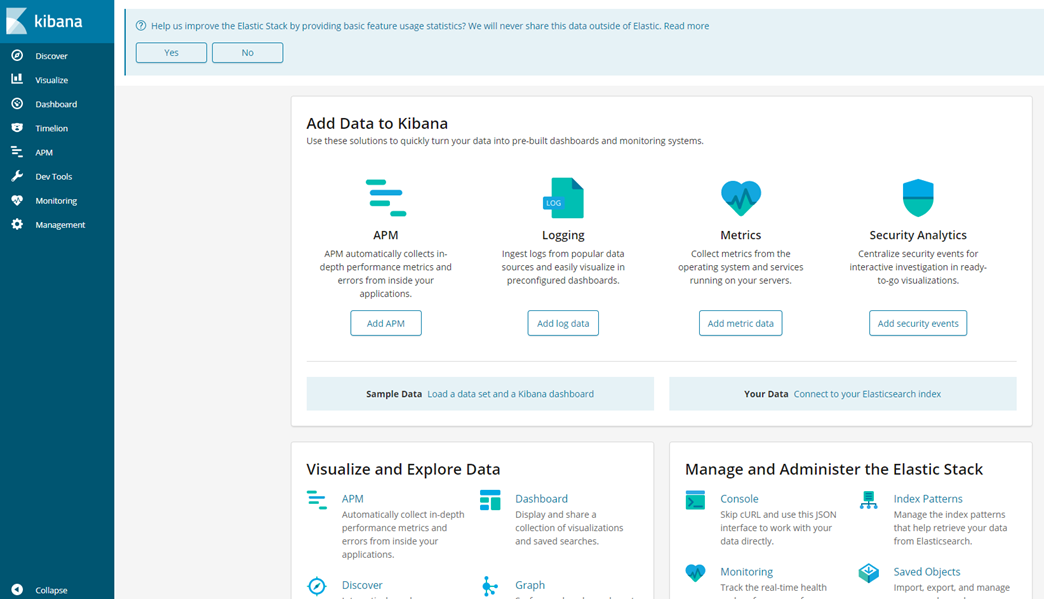
# 浏览器访问:http://192.168.8.25:5601,出现如下界面
注:因为现在没有数据,我们现在配置Nginx进行Nginx的日志收集
七、安装Nginx并配置收集日志
1、下载Nginx软件包
[root@localhost ~]# wget https://mirrors.yangxingzhen.com/nginx/nginx-1.15.2.tar.gz
2、解压软件包
[root@localhost ~]# tar zxf nginx-1.15.2.tar.gz
3、预编译
[root@localhost ~]# cd nginx-1.15.2
[root@localhost nginx-1.15.2]# yum -y install pcre pcre-devel openssl openssl-devel gcc gcc-c++
[root@localhost nginx-1.15.2]# ./configure --prefix=/usr/local/nginx --user=www --group=www --with-http_ssl_module --with-http_stub_status_module
4、编译及安装
[root@localhost nginx-1.15.2]# make && make install
5、编辑nginx.conf配置文件,配置内容如下
[root@localhost ~]# vim /usr/local/nginx/conf/nginx.conf
    user www www;
    worker_processes 2;
events {
    worker_connections 1024;
}
http {
    include mime.types;
    log_format json '{"@timestamp":"$time_iso8601",'
            '"host":"$server_addr",'
            '"clientip":"$remote_addr",'
            '"remote_user":"$remote_user",'
            '"request":"$request",'
            '"http_user_agent":"$http_user_agent",'
            '"size":$body_bytes_sent,'
            '"responsetime":$request_time,'
            '"upstreamtime":"$upstream_response_time",'
            '"upstreamhost":"$upstream_addr",'
            '"http_host":"$host",'
            '"requesturi":"$request_uri",'
            '"url":"$uri",'
            '"domain":"$host",'
            '"xff":"$http_x_forwarded_for",'
            '"referer":"$http_referer",'
            '"status":"$status"}';
    access_log logs/access.log json;
    default_type application/octet-stream;
    sendfile on;
    keepalive_timeout 65;
server {
    listen 80;
    server_name localhost;
    location / {
    root html;
    index index.html index.htm;
    }
    error_page 500 502 503 504 /50x.html;
    location = /50x.html {
    root html;
    }
}
}
[root@localhost nginx-1.15.2]# useradd -s /sbin/nologin www
[root@localhost nginx-1.15.2]# /usr/local/nginx/sbin/nginx -t
nginx: the configuration file /usr/local/nginx/conf/nginx.conf syntax is ok
nginx: configuration file /usr/local/nginx/conf/nginx.conf test is successful
[root@localhost nginx-1.15.2]# /usr/local/nginx/sbin/nginx
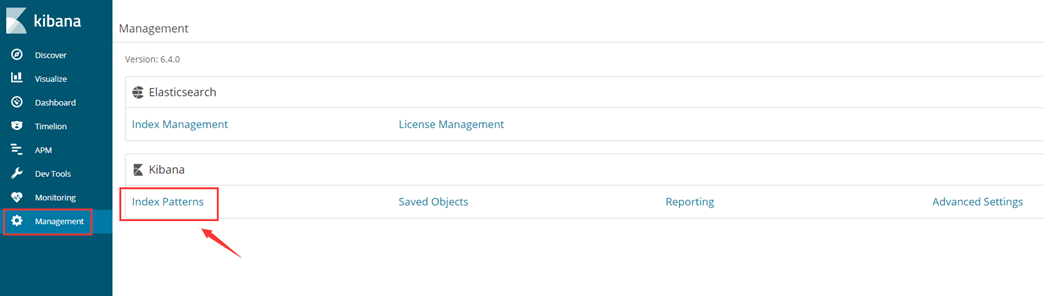
7、配置Kibana
1)点击Managemen à Index Patterns
2)创建索引
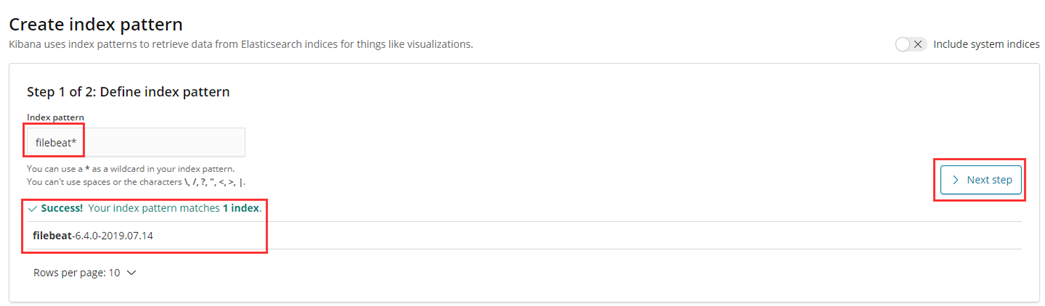
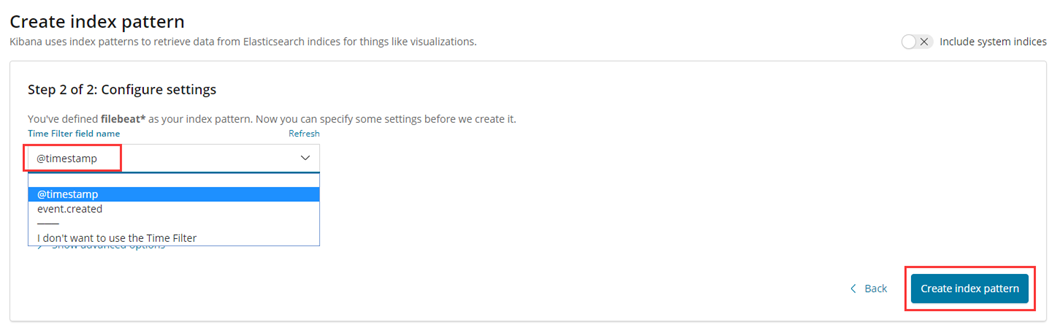
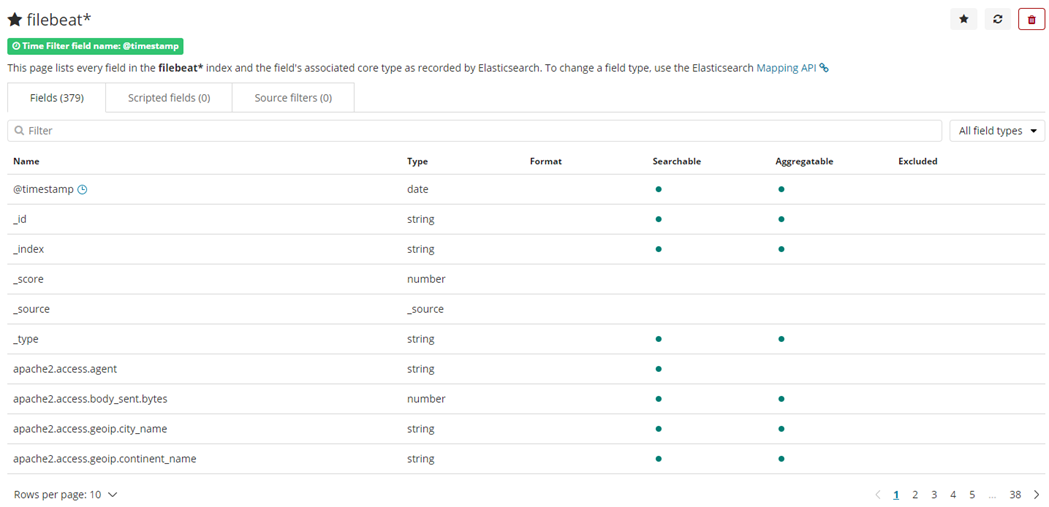
#索引创建完毕
3)查看日志
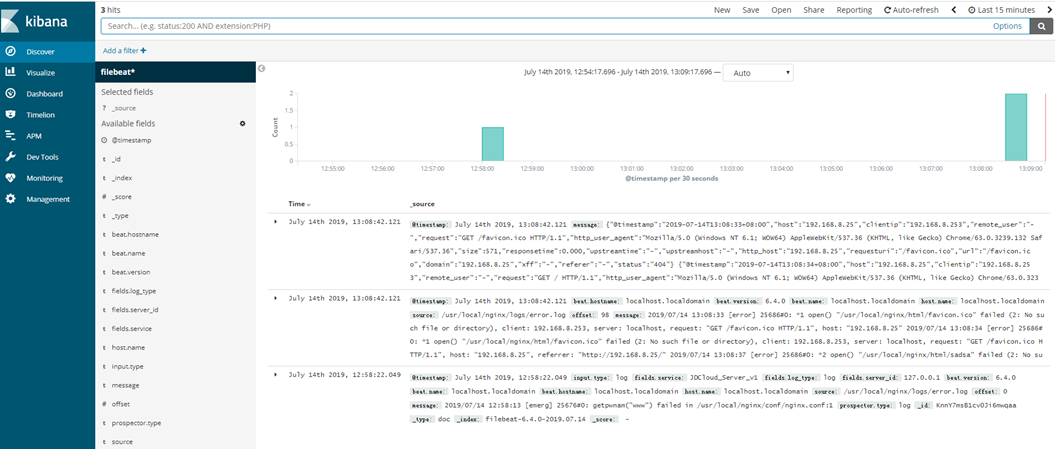
至此,ELK收集Nginx日志成功。
若文章图片、下载链接等信息出错,请在评论区留言反馈,博主将第一时间更新!如本文“对您有用”,欢迎随意打赏,谢谢!


写的不错
不错