
Zabbix监控MongoDB性能的原理:通过echo "db.serverStatus()" | mongo admin 来查看mongodb的状态。
Zabbix监控MongoDB性能,主要监控以下项目:
- 内存使用情况
- 连接数
- 锁
- 刷新写操作到磁盘
- 每秒执行的查询,插入,删除,更新等操作次数
- 每秒访问的索引次数,每秒命中索引的次数
- MongoDB产生的总的页面错误数量
- MongoDB的网络流量状况
监控操作步骤:
1、编写脚本
2、上传脚本到指定位置
3、修改zabbix_agent配置文件
4、zabbix_server的WEB界面导入模版
5、主机关联
1)编辑zabbix_agent配置文件,添加以下内容
[root@localhost ~]# vim /usr/local/zabbix/etc/zabbix_agentd.conf
UserParameter=Mongodb.state[*],/data/scripts/auto_detection_mongodb_state.sh $1
UserParameter=mongodb.status[*],/data/scripts/auto_detection_mongodb_status.sh $1
2)重启zabbix_agentd服务
[root@localhost ~]# service zabbix_agentd restart
3)下载脚本文件(获取监控值)
[root@localhost ~]# cd /data/scripts
[root@localhost scripts]# wget https://mirrors.yangxingzhen.com/shell/auto_detection_mongodb_status.sh
[root@localhost scripts]# wget https://mirrors.yangxingzhen.com/shell/auto_detection_mongodb_state.sh
[root@localhost scripts]# cat auto_detection_mongodb_status.sh
#!/bin/bash
# Description: zabbix mongodb monitor
# Note: Zabbix 4.0.7
# Date: 2019-7-31 21:20:39
# Verion: 1.0

DB_HOST=127.0.0.1
DB_PORT=27017
DB_BIN="/usr/local/mongodb/bin"

if [[ $# == 1 ]];then
case $1 in
	insert)
	echo "db.serverStatus().opcountersRepl" |${DB_BIN}/mongo ${DB_HOST}:${DB_PORT}/admin |grep "insert"|awk '{print $3}'|sed 's/,//'
	;;
	query)
	echo "db.serverStatus().opcountersRepl" |${DB_BIN}/mongo ${DB_HOST}:${DB_PORT}/admin |grep "query"|awk '{print $3}'|sed 's/,//'
	;;
	delete)
	echo "db.serverStatus().opcountersRepl" |${DB_BIN}/mongo ${DB_HOST}:${DB_PORT}/admin |grep "delete"|awk '{print $3}'|sed 's/,//'
	;;
	getmore)
	echo "db.serverStatus().opcountersRepl" |${DB_BIN}/mongo ${DB_HOST}:${DB_PORT}/admin |grep "getmore"|awk '{print $3}'|sed 's/,//'
	;;
	command)
	echo "db.serverStatus().opcountersRepl" |${DB_BIN}/mongo ${DB_HOST}:${DB_PORT}/admin |grep "command"|awk '{print $3}'|sed 's/,//'
	;;
	update)
	echo "db.serverStatus().opcountersRepl" |${DB_BIN}/mongo ${DB_HOST}:${DB_PORT}/admin |grep "update"|awk '{print $3}'|sed 's/,//'
	;;
	current)
	echo "db.serverStatus().connections"|${DB_BIN}/mongo ${DB_HOST}:${DB_PORT}/admin |grep -w "current"|awk '{print $4}'|sed 's/,//'
	;;
	available)
	echo "db.serverStatus().connections"|${DB_BIN}/mongo ${DB_HOST}:${DB_PORT}/admin |grep -w "available"|awk '{print $7}'|sed 's/,//'
	;;
	totalCreated)
	echo "db.serverStatus().connections"|${DB_BIN}/mongo ${DB_HOST}:${DB_PORT}/admin |grep -w "totalCreated"|awk '{print $10}'|sed 's/,//'
	;;
	total)
	echo "db.serverStatus().globalLock.activeClients"|${DB_BIN}/mongo ${DB_HOST}:${DB_PORT}/admin |grep "total"|awk '{print $4}'|sed 's/,//'
	;;
	readers)
	echo "db.serverStatus().globalLock.activeClients"|${DB_BIN}/mongo ${DB_HOST}:${DB_PORT}/admin |grep "readers"|awk '{print $7}'|sed 's/,//'
	;;
	writers)
	echo "db.serverStatus().globalLock.activeClients"|${DB_BIN}/mongo ${DB_HOST}:${DB_PORT}/admin |grep "writers"|awk '{print $10}'|sed 's/,//'
	;;
	deleted)
	echo "db.serverStatus().metrics.document"|${DB_BIN}/mongo ${DB_HOST}:${DB_PORT}/admin |grep -w "deleted"|awk -F '(' '{print $2}'|sed 's/),//'
	;;
	inserted)
	echo "db.serverStatus().metrics.document"|${DB_BIN}/mongo ${DB_HOST}:${DB_PORT}/admin |grep -w "inserted"|awk -F '(' '{print $2}'|sed 's/),//'
	;;
	returned)
	echo "db.serverStatus().metrics.document"|${DB_BIN}/mongo ${DB_HOST}:${DB_PORT}/admin |grep -w "returned"|awk -F '(' '{print $2}'|sed 's/),//'
	;;
	updated)
	echo "db.serverStatus().metrics.document"|${DB_BIN}/mongo ${DB_HOST}:${DB_PORT}/admin |grep -w "updated"|awk -F '(' '{print $2}'|sed 's/)//'
	;;
	totalTime)
	echo "db.serverStatus().globalLock"|${DB_BIN}/mongo ${DB_HOST}:${DB_PORT}/admin |grep "totalTime" |awk '{print $3}'|awk -F '"' '{print $2}'
	;;
	bytesIn)
	echo "db.serverStatus().network"|${DB_BIN}/mongo ${DB_HOST}:${DB_PORT}/admin |grep "bytesIn"|awk -F'(' '{print $2}'|sed 's/),//'
	;;
	bytesOut)
	echo "db.serverStatus().network"|${DB_BIN}/mongo ${DB_HOST}:${DB_PORT}/admin |grep "bytesOut"|awk -F'(' '{print $2}'|sed 's/),//'
	;;
	numRequests)
	echo "db.serverStatus().network"|${DB_BIN}/mongo ${DB_HOST}:${DB_PORT}/admin |grep "numRequests"|awk -F'(' '{print $2}'|sed 's/)//'
	;;
	mapped)
	echo "db.serverStatus().mem" |${DB_BIN}/mongo ${DB_HOST}:${DB_PORT}/admin |grep -w "mapped"|awk '{print $3}'|sed 's/,//'
	;;
	resident)
	echo "db.serverStatus().mem" |${DB_BIN}/mongo ${DB_HOST}:${DB_PORT}/admin |grep -w "mappedWithJournal"|awk '{print $3}'|sed 's/,//'
	;;
	virtual)
	echo "db.serverStatus().mem" |${DB_BIN}/mongo ${DB_HOST}:${DB_PORT}/admin |grep -w "virtual"|awk '{print $3}'|sed 's/,//'
	;;
	mappedWithJournal)
	echo "db.serverStatus().mem" |${DB_BIN}/mongo ${DB_HOST}:${DB_PORT}/admin |grep -w "resident"|awk '{print $3}'|sed 's/,//'
	;;
	*)
	echo -e "\033[33mUsage: $0 {insert|query|delete|getmore|command|update|current|available|totalCreated|total|readers|writers|deleted|inserted|returned|updated|totalTime|bytesIn|bytesOut|numRequests||mapped|resident}\033[0m"
	exit 1
esac
else
	echo -e "\033[33mUsage: $0 {insert|query|delete|getmore|command|update|current|available|totalCreated|total|readers|writers|deleted|inserted|returned|updated|totalTime|bytesIn|bytesOut|numRequests||mapped|resident}\033[0m"
	exit 1
fi
[root@localhost scripts]# cat auto_detection_mongodb_state.sh
#!/bin/bash
# Description: zabbix mongodb monitor
# Note: Zabbix 4.0.7
# Date: 2019-7-31 21:01:22
# Verion: 1.0

DB_HOST="127.0.0.1"
DB_PORT="27017"
DB_BIN="/usr/local/mongodb/bin"

if [[ $# == 1 ]];then
case $1 in
	insert)
	echo "db.serverStatus().opcounters" |${DB_BIN}/mongo ${DB_HOST}:${DB_PORT}/admin |grep "insert"|awk '{print $3}'|sed 's/,//'
	;;
	query)
	echo "db.serverStatus().opcounters" |${DB_BIN}/mongo ${DB_HOST}:${DB_PORT}/admin |grep "query"|awk '{print $3}'|sed 's/,//'
	;;
	delete)
	echo "db.serverStatus().opcounters" |${DB_BIN}/mongo ${DB_HOST}:${DB_PORT}/admin |grep "delete"|awk '{print $3}'|sed 's/,//'
	;;
	getmore)
	echo "db.serverStatus().opcounters" |${DB_BIN}/mongo ${DB_HOST}:${DB_PORT}/admin |grep "getmore"|awk '{print $3}'|sed 's/,//'
	;;
	command)
	echo "db.serverStatus().opcounters" |${DB_BIN}/mongo ${DB_HOST}:${DB_PORT}/admin |grep "command"|awk '{print $3}'|sed 's/,//'
	;;
	update)
	echo "db.serverStatus().opcounters" |${DB_BIN}/mongo ${DB_HOST}:${DB_PORT}/admin |grep "update"|awk '{print $3}'|sed 's/,//'
	;;
	total)
	echo "db.serverStatus().globalLock.currentQueue"|${DB_BIN}/mongo ${DB_HOST}:${DB_PORT}/admin |grep "total"|awk '{print $4}'|sed 's/,//'
	;;
	readers)
	echo "db.serverStatus().globalLock.currentQueue"|${DB_BIN}/mongo ${DB_HOST}:${DB_PORT}/admin |grep "readers"|awk '{print $7}'|sed 's/,//'
	;;
	writers)
	echo "db.serverStatus().globalLock.currentQueue"|${DB_BIN}/mongo ${DB_HOST}:${DB_PORT}/admin |grep "writers"|awk '{print $10}'|sed 's/,//'
	;;
	*)
	echo -e  "\033[33mUsage: $0 {insert|query|delete|getmore|command|update|total|readers|writers}\033[0m"
	exit 1
esac
else
	echo -e  "\033[33mUsage: $0 {insert|query|delete|getmore|command|update|total|readers|writers}\033[0m"
	exit 1
fi
[root@localhost scripts]# chmod +x auto_detection_mongodb_status.sh
[root@localhost scripts]# chmod +x auto_detection_mongodb_state.sh
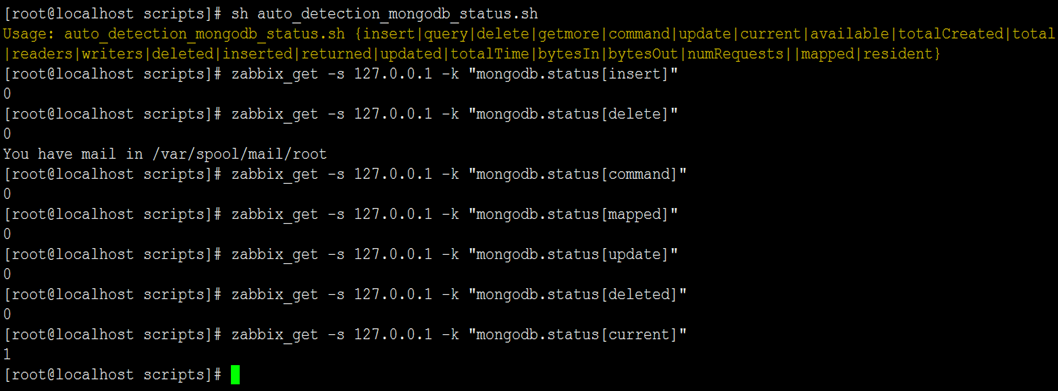
5)验证server端验证是否能获取agent端的key值
#使用zabbix_get命令获取key值
Zabbix监控平台配置
1、下载监控模板文件
模板附件下载:
2、导入Mongodb监控模板
进入后台->配置->模板->导入(右上角)->选择下载的模板文件->最后点击导入 。
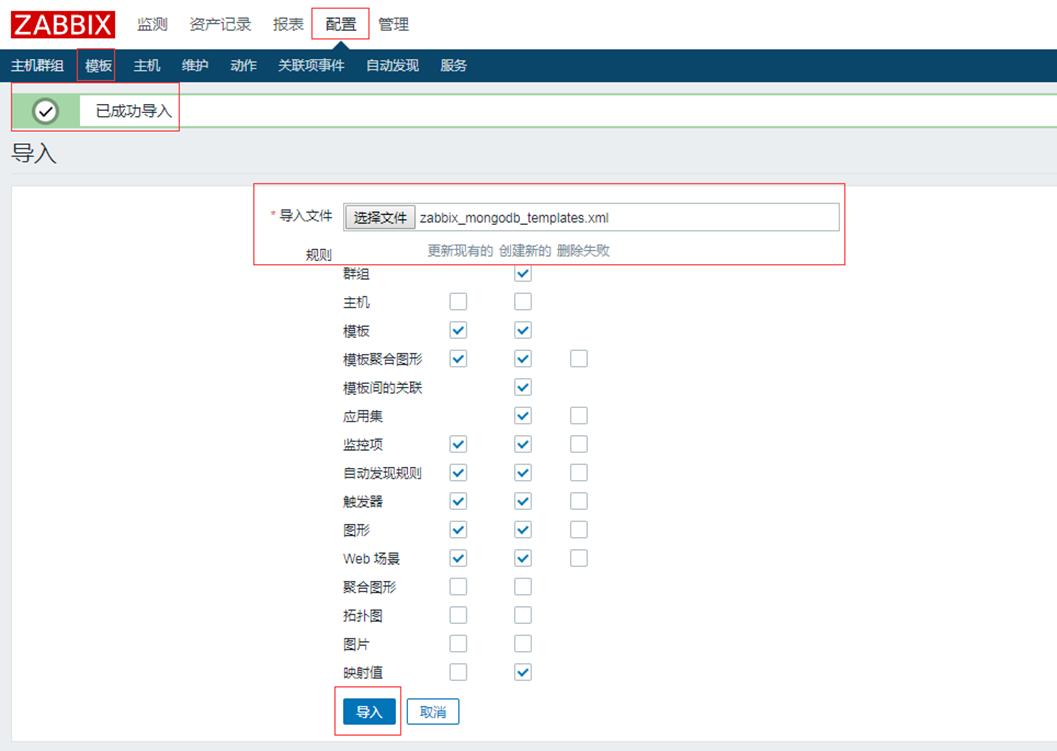
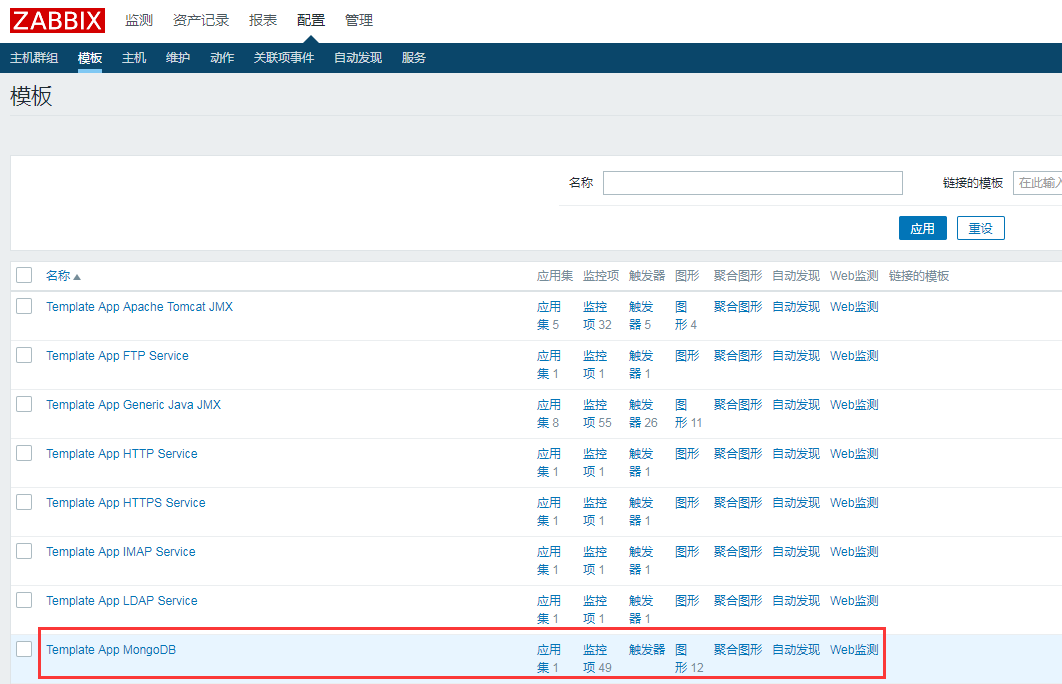
至此Mongodb监控模板已经导入到Zabbix中。
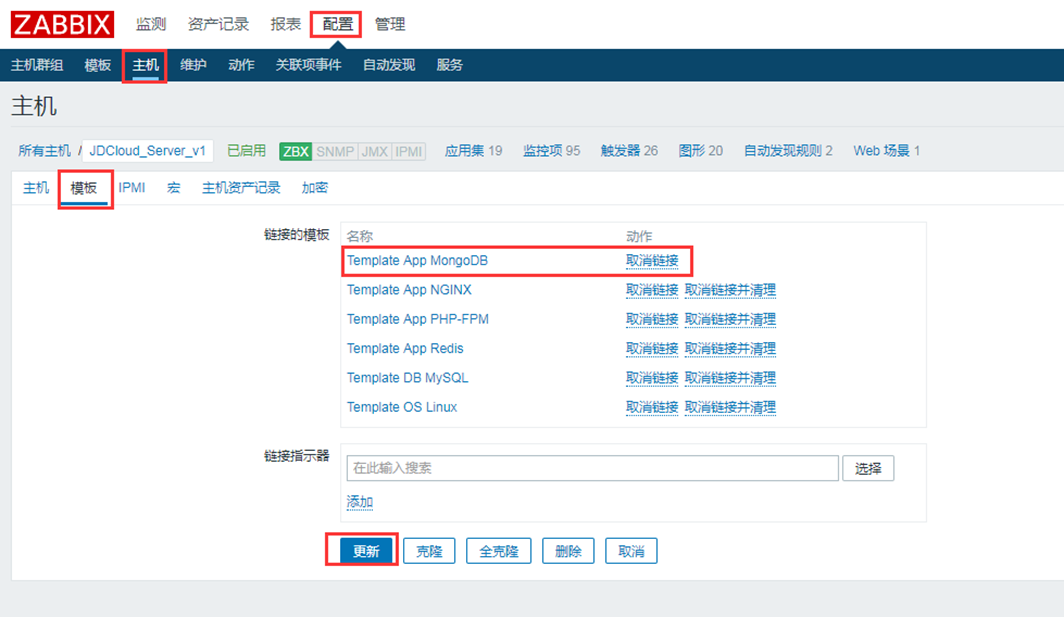
3、关联模板
需要把Mongodb监控模板链接到你的监控主机上,进入后台->配置->点击你的主机->模板->选择刚才导入模板,点击添加,最后点击更新即可。
4、效果图展示
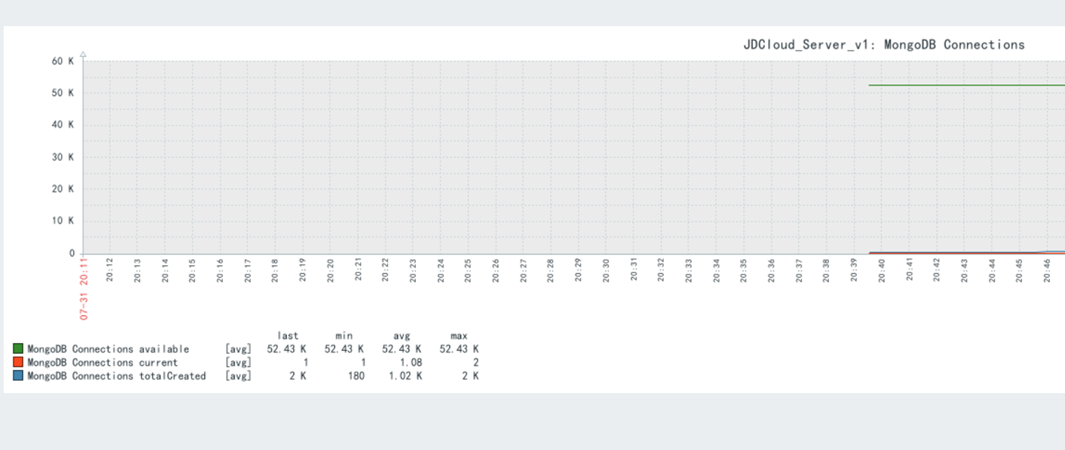
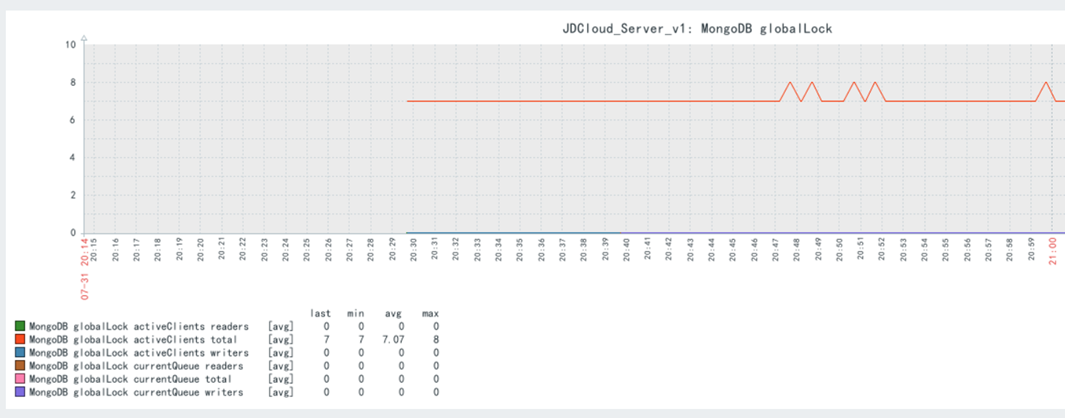
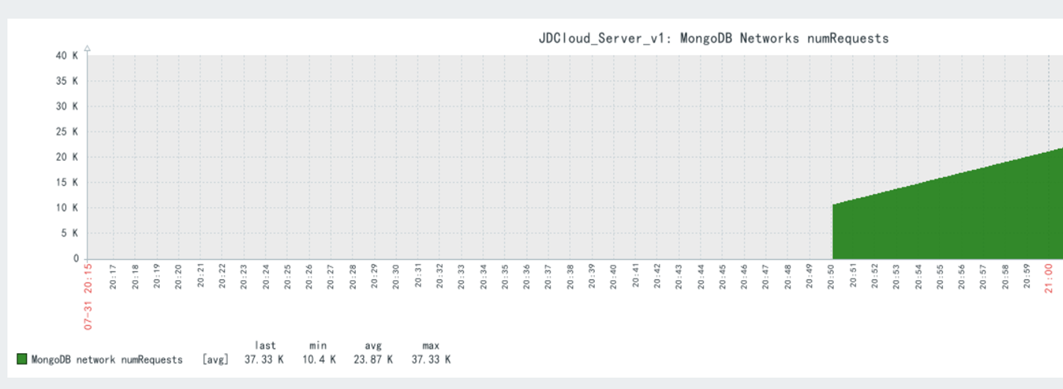
若文章图片、下载链接等信息出错,请在评论区留言反馈,博主将第一时间更新!如本文“对您有用”,欢迎随意打赏,谢谢!


评论