
一、ELK简介
ELK是三个开源软件的缩写,分别为:Elasticsearch 、 Logstash以及Kibana , 它们都是开源软件。不过现在还新增了一个Beats,它是一个轻量级的日志收集处理工具(Agent),Beats占用资源少,适合于在各个服务器上搜集日志后传输给Logstash,官方也推荐此工具,目前由于原本的ELK Stack成员中加入了 Beats 工具所以已改名为Elastic Stack。
Elastic Stack包含:
Elasticsearch是个开源分布式搜索引擎,提供搜集、分析、存储数据三大功能。它的特点有:分布式,零配置,自动发现,索引自动分片,索引副本机制,restful风格接口,多数据源,自动搜索负载等。
详细可参考Elasticsearch权威指南
Logstash 主要是用来日志的搜集、分析、过滤日志的工具,支持大量的数据获取方式。一般工作方式为c/s架构,client端安装在需要收集日志的主机上,server端负责将收到的各节点日志进行过滤、修改等操作在一并发往elasticsearch上去。
Kibana 也是一个开源和免费的工具,Kibana可以为 Logstash 和 ElasticSearch 提供的日志分析友好的 Web 界面,可以帮助汇总、分析和搜索重要数据日志。
Beats在这里是一个轻量级日志采集器,其实Beats家族有6个成员,早期的ELK架构中使用Logstash收集、解析日志,但是Logstash对内存、cpu、io等资源消耗比较高。相比 Logstash,Beats所占系统的CPU和内存几乎可以忽略不计
ELK Stack (5.0版本之后)--> Elastic Stack == (ELK Stack + Beats)。目前Beats包含六种工具:
Packetbeat: 网络数据(收集网络流量数据)
Metricbeat: 指标 (收集系统、进程和文件系统级别的 CPU 和内存使用情况等数据)
Filebeat: 日志文件(收集文件数据)
Winlogbeat: windows事件日志(收集 Windows 事件日志数据)
Auditbeat:审计数据 (收集审计日志)
Heartbeat:运行时间监控 (收集系统运行时的数据)
ELK官网:https://www.elastic.co/cn/
中文指南:https://www.gitbook.com/book/chenryn/elk-stack-guide-cn/details
1、环境准备
操作系统:CentOS Linux release 7.7.1908 (Core)
服务器IP:192.168.0.4
2、软件版本
elasticsearch:elasticsearch-7.5.1-linux-x86_64.tar.gz
kibana:kibana-7.5.1-linux-x86_64.tar.gz
logstash:logstash-7.5.1.tar.gz
filebeat:filebeat-7.5.1-linux-x86_64.tar.gz
JDK:JDK-1.8.0_181
二、基础环境配置
1、关闭防火墙和selinux
[root@localhost ~]# systemctl stop firewalld
[root@localhost ~]# systemctl disable firewalld
[root@localhost ~]# setenforce 0
[root@localhost ~]# sed -i '/SELINUX/s/enforcing/disabled/' /etc/selinux/config
2、内核优化
[root@localhost ~]# vim /etc/security/limits.conf
#在文件最后添加以下内容
* soft nofile 65537
* hard nofile 65537
* soft nproc 65537
* hard nproc 65537
[root@localhost ~]# vim /etc/security/limits.d/20-nproc.conf
#修改以下内容
* soft nproc 4096
[root@localhost ~]# vim /etc/sysctl.conf
#添加以下内容
vm.max_map_count = 262144
net.core.somaxconn= 65535
net.ipv4.ip_forward = 1
#执行sysctl -p使其生效
[root@localhost ~]# sysctl -p
3、安装JDK环境
[root@localhost ~]# wget https://mirrors.yangxingzhen.com/jdk/jdk-8u181-linux-x64.tar.gz
[root@localhost ~]# tar zxf jdk-8u181-linux-x64.tar.gz -C /usr/local
#配置/etc/profile,添加以下内容
[root@localhost ~]# vim /etc/profile
export JAVA_HOME=/usr/local/jdk1.8.0_181
export CLASSPATH=$CLASSPATH:$JAVA_HOME/lib:$JAVA_HOME/jre/lib
export PATH=$JAVA_HOME/bin:$JAVA_HOME/jre/bin:$PATH:$HOMR/bin
[root@localhost ~]# source /etc/profile
#看到如下信息,java环境配置成功
[root@localhost ~]# java -version
java version "1.8.0_181"
Java(TM) SE Runtime Environment (build 1.8.0_181-b13)
Java HotSpot(TM) 64-Bit Server VM (build 25.181-b13, mixed mode)
4、创建ELK用户
[root@localhost ~]# useradd elk
三、安装elasticsearch
1、创建持久化目录及logs日志目录
[root@localhost ~]# mkdir -p /data/elasticsearch/{data,logs}
2、下载elasticsearch软件包
[root@localhost ~]# wget https://artifacts.elastic.co/downloads/elasticsearch/elasticsearch-7.5.1-linux-x86_64.tar.gz
3、解压并重命名
[root@localhost ~]# tar xf elasticsearch-7.5.1-linux-x86_64.tar.gz
[root@localhost ~]# mv elasticsearch-7.5.1 /usr/local/elasticsearch
4、修改elasticsearch.yml配置文件,文件内容如下
[root@localhost ~]# vim /usr/local/elasticsearch/config/elasticsearch.yml
# 集群名称
cluster.name: es
# 节点名称
node.name: es-master
# 存放数据目录,先创建该目录
path.data: /data/elasticsearch/data
# 存放日志目录,先创建该目录
path.logs: /data/elasticsearch/logs
# 节点IP
network.host: 192.168.0.4
# tcp端口
transport.tcp.port: 9300
# http端口
http.port: 9200
# 主合格节点列表,若有多个主节点,则主节点进行对应的配置
cluster.initial_master_nodes: ["192.168.0.4:9300"]
# 是否允许作为主节点
node.master: true
# 是否保存数据
node.data: true
node.ingest: false
node.ml: false
cluster.remote.connect: false
# 跨域
http.cors.enabled: true
http.cors.allow-origin: "*"
5、ELK用户授权
[root@localhost ~]# chown -R elk.elk /usr/local/elasticsearch/
[root@localhost ~]# chown -R elk.elk /data/elasticsearch/*
6、启动elasticsearch服务(第一次先测试好然后再加-d后台启动)
[root@localhost ~]# su - elk
[elk@localhost ~]$ /usr/local/elasticsearch/bin/elasticsearch
7、后台启动elasticsearch服务
[elk@localhost ~]$ /usr/local/elasticsearch/bin/elasticsearch -d
8、监控检测
[elk@localhost ~]$ curl -X GET 'http://192.168.0.4:9200/_cluster/health?pretty'
{
"cluster_name" : "es",
"status" : "yellow",
"timed_out" : false,
"number_of_nodes" : 1,
"number_of_data_nodes" : 1,
"active_primary_shards" : 6,
"active_shards" : 6,
"relocating_shards" : 0,
"initializing_shards" : 0,
"unassigned_shards" : 2,
"delayed_unassigned_shards" : 0,
"number_of_pending_tasks" : 0,
"number_of_in_flight_fetch" : 0,
"task_max_waiting_in_queue_millis" : 0,
"active_shards_percent_as_number" : 75.0
}
#status=green表示服务正常
Elasticsearch常用命令
curl -XDELETE 'http://host.IP.address:9200/logstash-*' 删除索引(后面为索引名称)
curl -XGET 'host.IP.address:9200/_cat/health?v&pretty' 查看集群状态
curl -XGET 'host.IP.address:9200/_cat/indices?v&pretty' 查看索引
四、安装Kibana
1、下载Kibana软件包
[root@localhost ~]$ wget https://artifacts.elastic.co/downloads/kibana/kibana-7.5.1-linux-x86_64.tar.gz
2、解压Kibana软件包并重命名
[root@localhost ~]$ tar xf kibana-7.5.1-linux-x86_64.tar.gz
[root@localhost ~]$ mv kibana-7.5.1-linux-x86_64 /usr/local/kibana
3、配置Kibana配置文件
[root@localhost ~]$ vim /usr/local/kibana/config/kibana.yml
#配置内容如下
# 配置kibana的端口
server.port: 5601
# 配置监听ip
server.host: "192.168.0.4"
# 配置es服务器的ip,如果是集群则配置该集群中主节点的ip
elasticsearch.hosts: ["http://192.168.0.4:9200"]
# 配置kibana的日志文件路径,不然默认是messages里记录日志
logging.dest: /usr/local/kibana/logs/kibana.log
# 配置为中文
i18n.locale: "zh-CN"
4、创建日志目录并授权
[root@localhost ~]# mkdir /usr/local/kibana/logs
[root@localhost ~]# chown -R elk.elk /usr/local/kibana/
5、启动Kibana服务
[root@localhost ~]# su - elk
#前台启动
[elk@localhost ~]$ /usr/local/kibana/bin/kibana
#后台启动
[elk@localhost ~]$ /usr/local/kibana/bin/kibana &
温馨提示:可以先前台启动查看日志,正常之后在后台启动。
五、安装filebeat
1、下载filebeat软件包
[root@localhost ~]# wget https://artifacts.elastic.co/downloads/beats/filebeat/filebeat-7.5.1-linux-x86_64.tar.gz
2、解压并重命名
[root@localhost ~]# tar xf filebeat-7.5.1-linux-x86_64.tar.gz
[root@localhost ~]# mv filebeat-7.5.1-linux-x86_64 /usr/local/filebeat
[root@localhost ~]# chown -R elk.elk /usr/local/filebeat/
3、编辑filebeat.yml配置文件,配置内容如下
[root@localhost ~]# vim /usr/local/filebeat/filebeat.yml
#=============== Filebeat inputs =================
filebeat.inputs:
- type: log
  paths:
   - /usr/local/nginx/logs/access_wordpress.log
  fields:
   log_source: nginx-access
- type: log
  paths:
   - /usr/local/nginx/logs/error_wordpress.log
  fields:
   log_source: nginx-error
#================ Dashboards ================
setup.dashboards.enabled: false
#================ Kibana ==================
#添加libana仪表盘
setup.kibana:
  host: "192.168.0.4:5601"
#----------------------------- Logstash output --------------------------------
output.logstash:
  # The Logstash hosts
  hosts: ["192.168.0.4:5044"]
4、启动filebeat服务
[root@localhost ~]# su - elk
[elk@localhost ~]# cd /usr/local/filebeat
#前台启动
[elk@localhost filebeat]$ ./filebeat -e -c filebeat.yml
#后台启动
[elk@localhost filebeat]$ nohup ./filebeat -e -c filebeat.yml &
六、安装logstash
1、下载软件包
[root@localhost ~]# wget https://artifacts.elastic.co/downloads/logstash/logstash-7.5.1.tar.gz
2、解压并重命名
[root@localhost ~]# tar zxf logstash-7.5.1.tar.gz
[root@localhost ~]# mv logstash-7.5.1 /usr/local/logstash
3、创建nginx.conf文件,添加以下内容
[root@localhost ~]# vim /usr/local/logstash/config/nginx.conf
input {
  beats {
    port => 5044
  }
}
filter {
  if [fields][log_source]=="access_wordpress"{
    grok {
      match => {
        "message" => '%{IP:clientip}\s*%{DATA}\s*%{DATA}\s*\[%{HTTPDATE:requesttime}\]\s*"%{WORD:requesttype}.*?"\s*%{NUMBER:status:int}\s*%{NUMBER:bytes_read:int}\s*"%{DATA:requesturl}"\s*%{QS:ua}'
     }
      overwrite => ["message"]
    }
  }
  if [fields][log_source]=="error_wordpress"{
    grok {
      match => {
        "message" => '(?<time>.*?)\s*\[%{LOGLEVEL:loglevel}\]\s*%{DATA}:\s*%{DATA:errorinfo},\s*%{WORD}:\s*%{IP:clientip},\s*%{WORD}:%{DATA:server},\s*%{WORD}:\s*%{QS:request},\s*%{WORD}:\s*%{QS:upstream},\s*%{WORD}:\s*"%{IP:hostip}",\s*%{WORD}:\s*%{QS:referrer}'
      }
      overwrite => ["message"]
    }
  }
}
output {
  if [fields][log_source]=="access_wordpress"{
    elasticsearch {
      hosts => ["http://192.168.0.4:9200"]
      action => "index"
      index => "nginx-access-%{+YYYY.MM.dd}"
   }
  }
  if [fields][log_source]=="error_wordpress"{
    elasticsearch {
      hosts => ["http://192.168.0.4:9200"]
      action => "index"
      index => "nginx-error-%{+YYYY.MM.dd}"
   }
  }
  stdout { codec => rubydebug }
}
4、启动logstash服务
[root@localhost ~]# chown -R elk.elk /usr/local/logstash
[root@localhost ~]# su - elk
#前台启动
[elk@localhost ~]$ /usr/local/logstash/bin/logstash -f /usr/local/logstash/config/nginx.conf
#后台启动
[elk@localhost ~]$ nohup /usr/local/logstash/bin/logstash -f /usr/local/logstash/config/nginx.conf &
七、访问Kibana
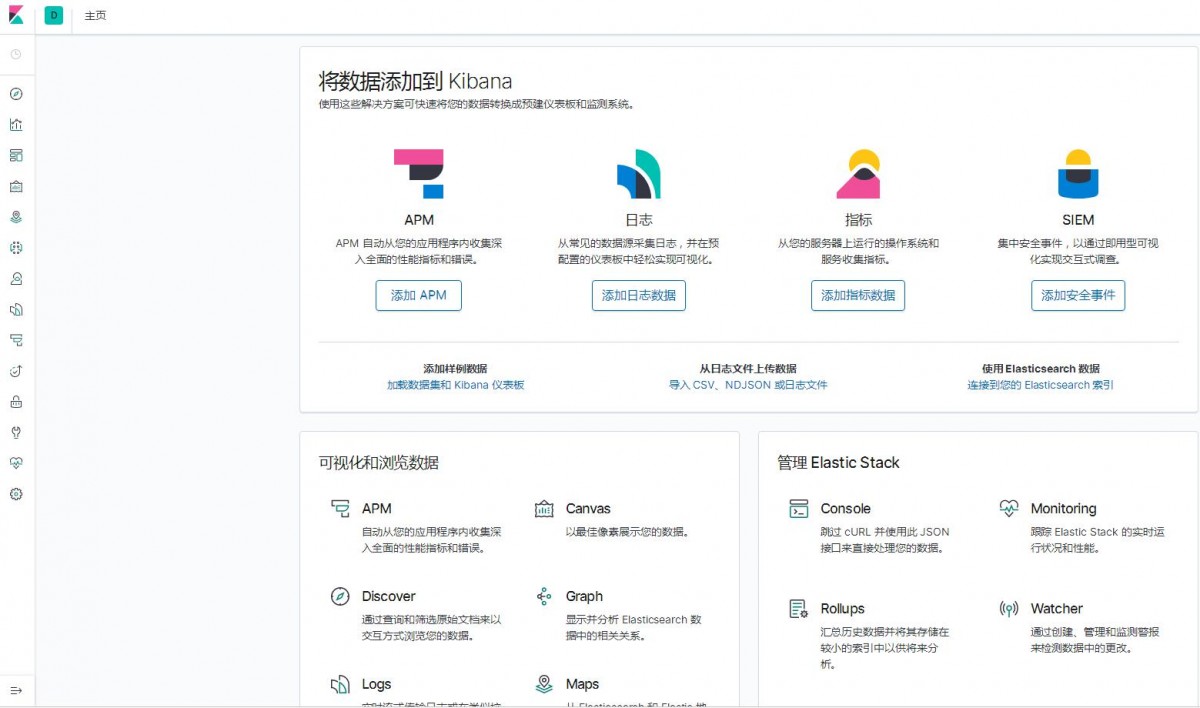
1、浏览器访问:http://192.168.0.4:5601,出现如下界面
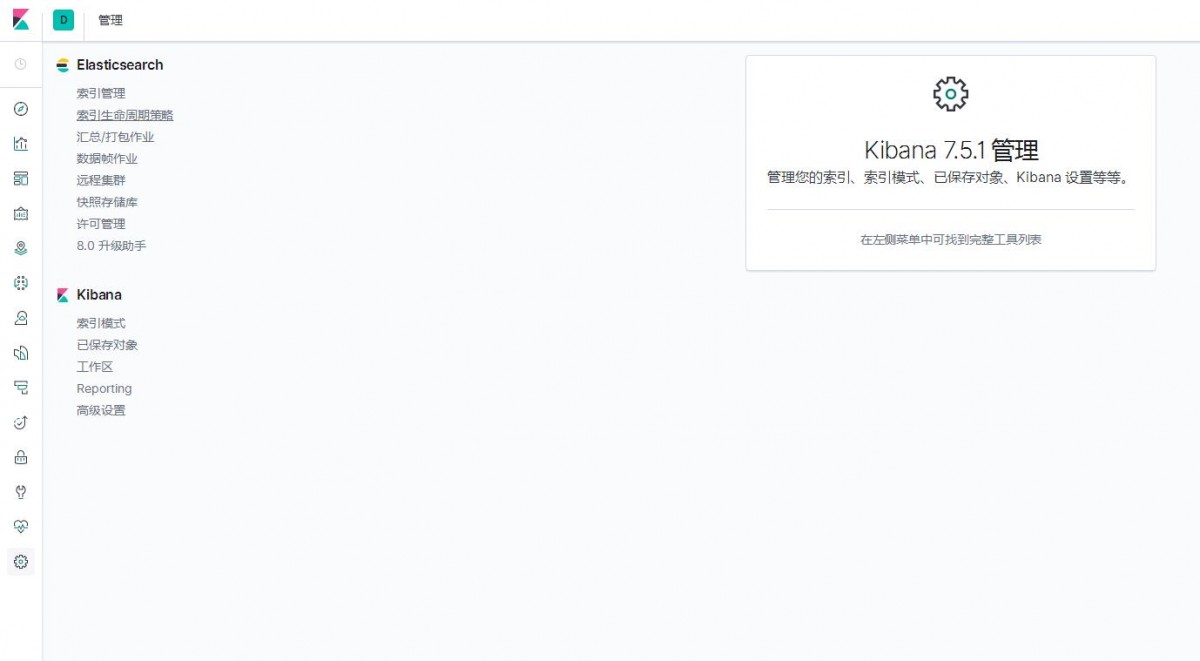
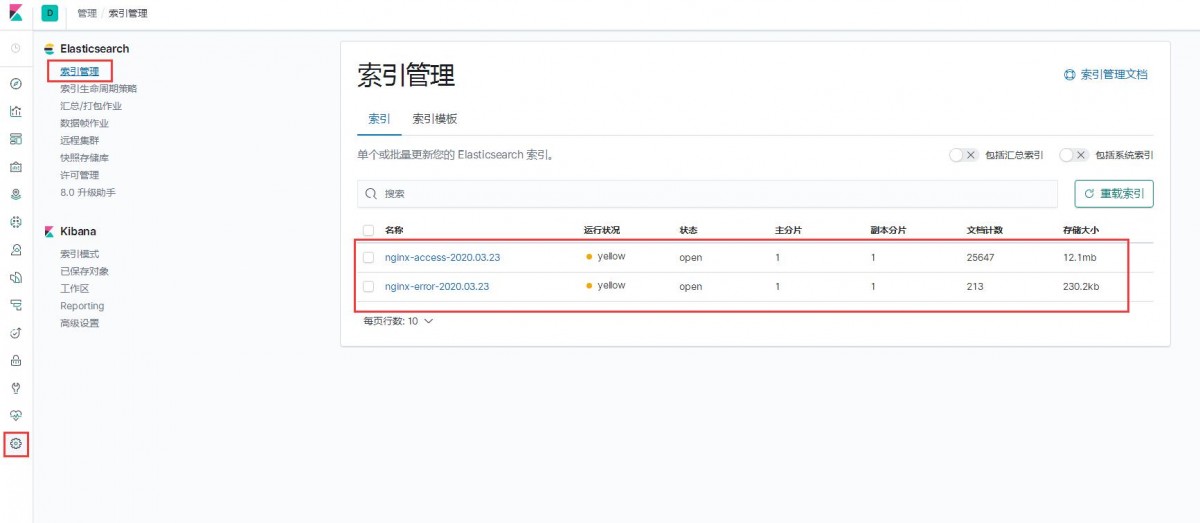
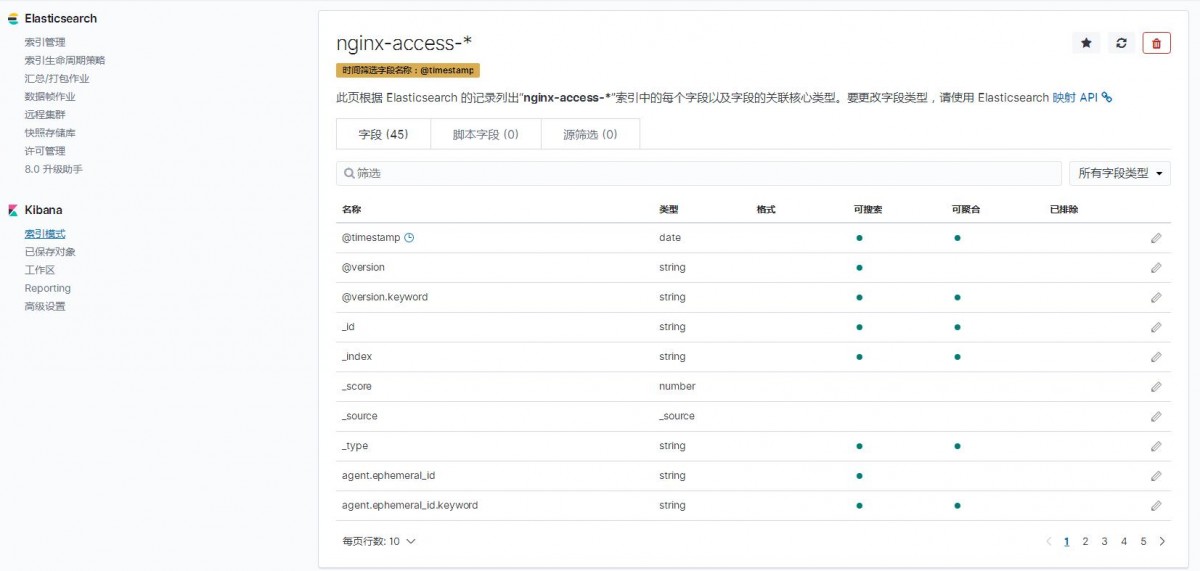
2、分别点击管理--》索引管理,这时候就能看到Nginx的访问日志和错误日志的数据
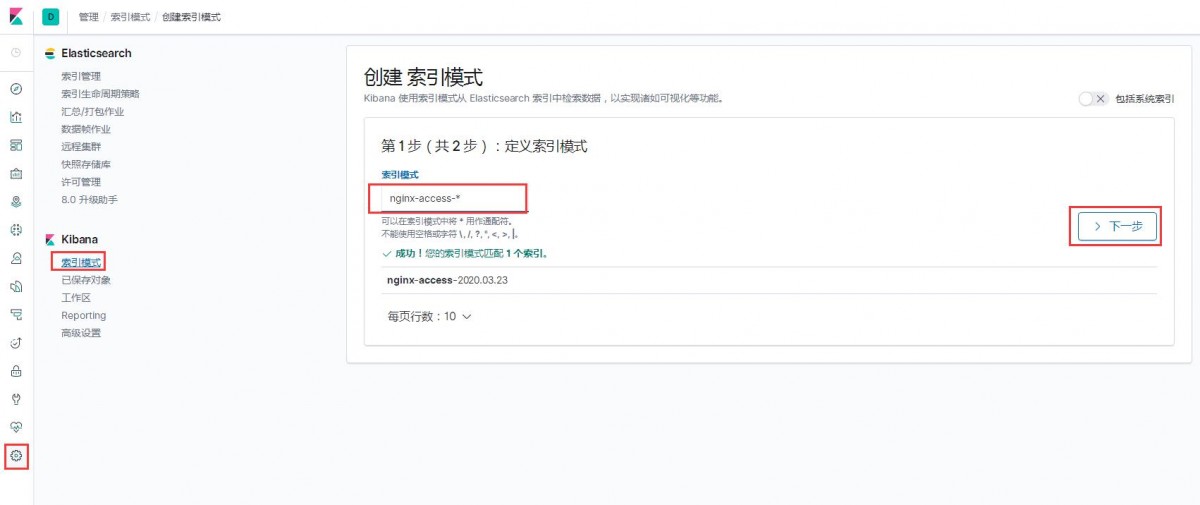
3、创建Nginx访问日志索引
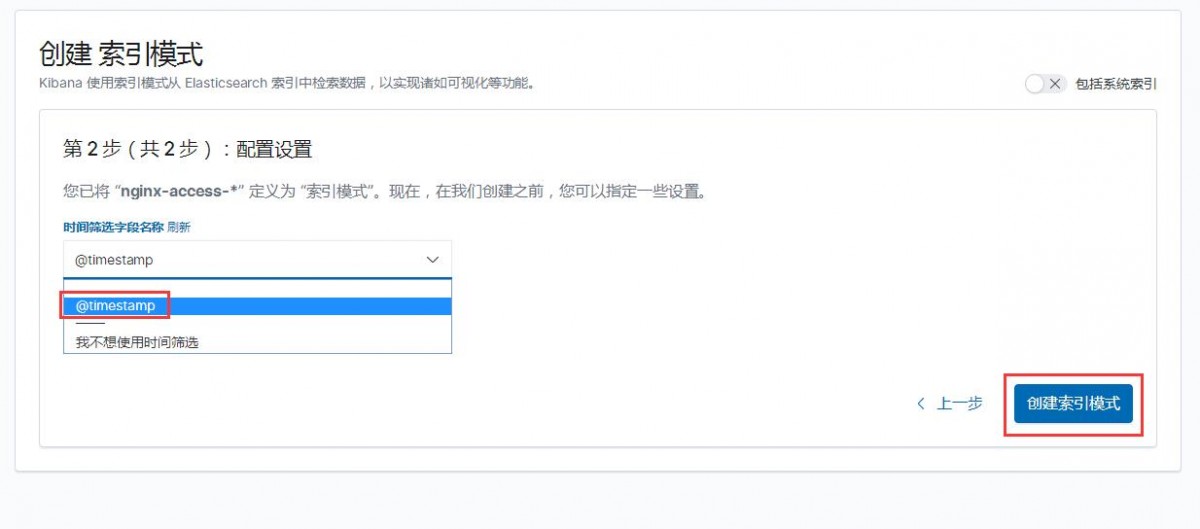
1)索引模式--->>创建索引模式,输入索引模式名称,点击下一步
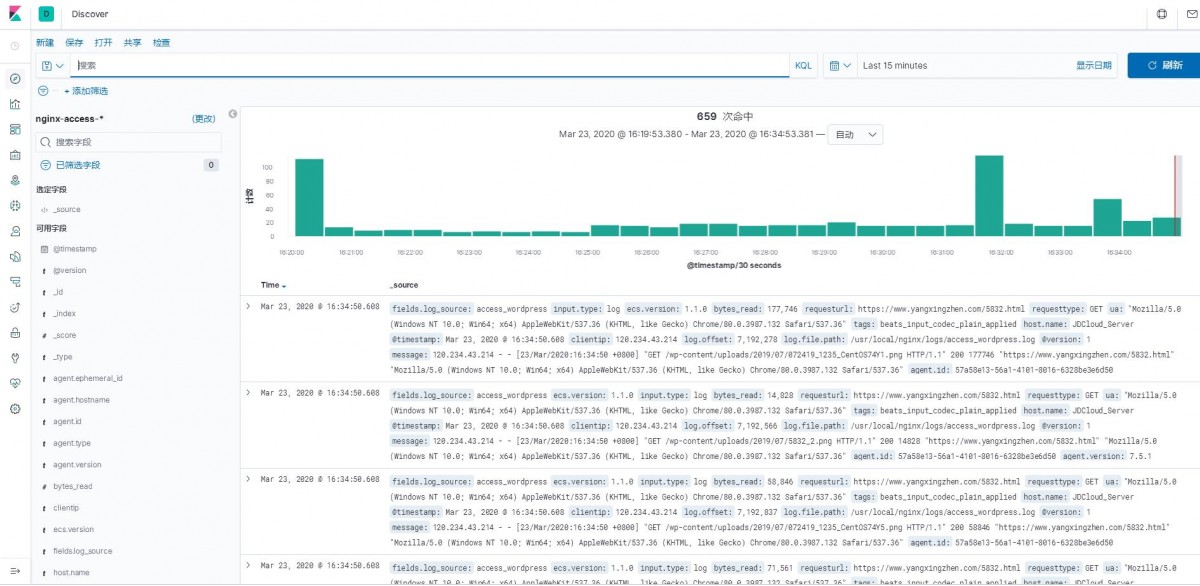
2)点击Discover,就能看到日志数据了,如下图
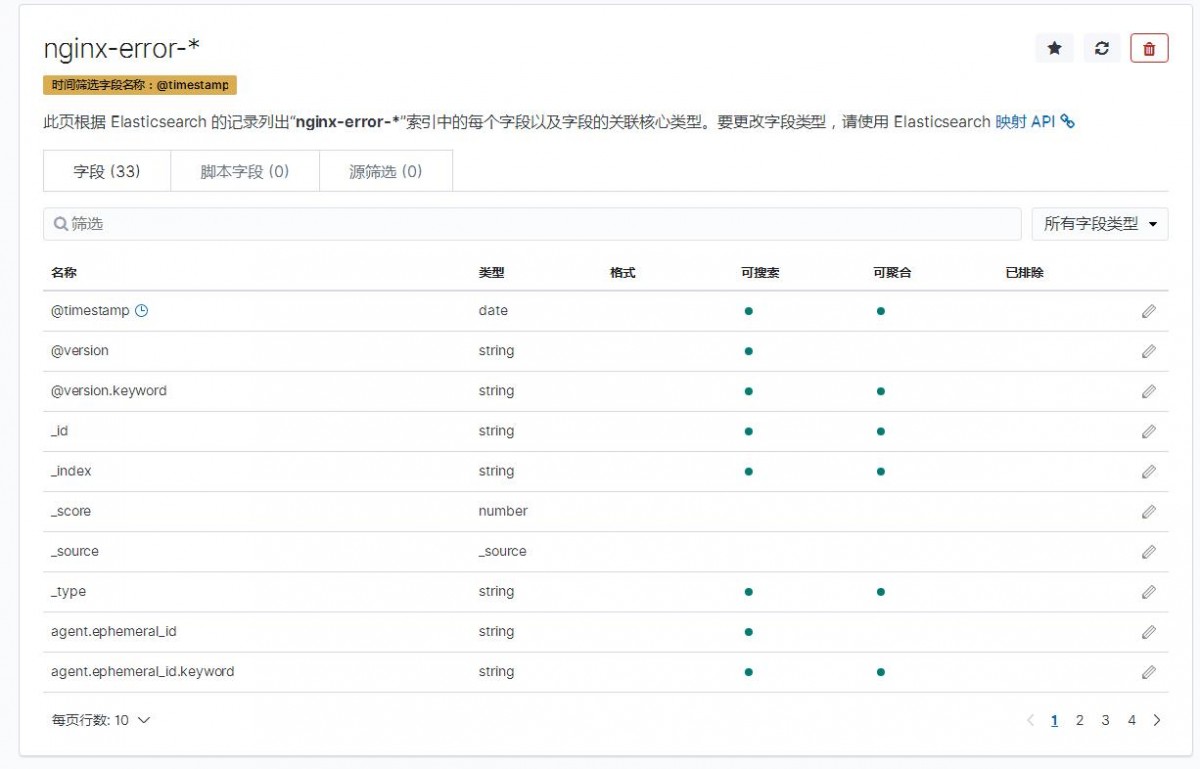
4、创建Nginx错误日志索引
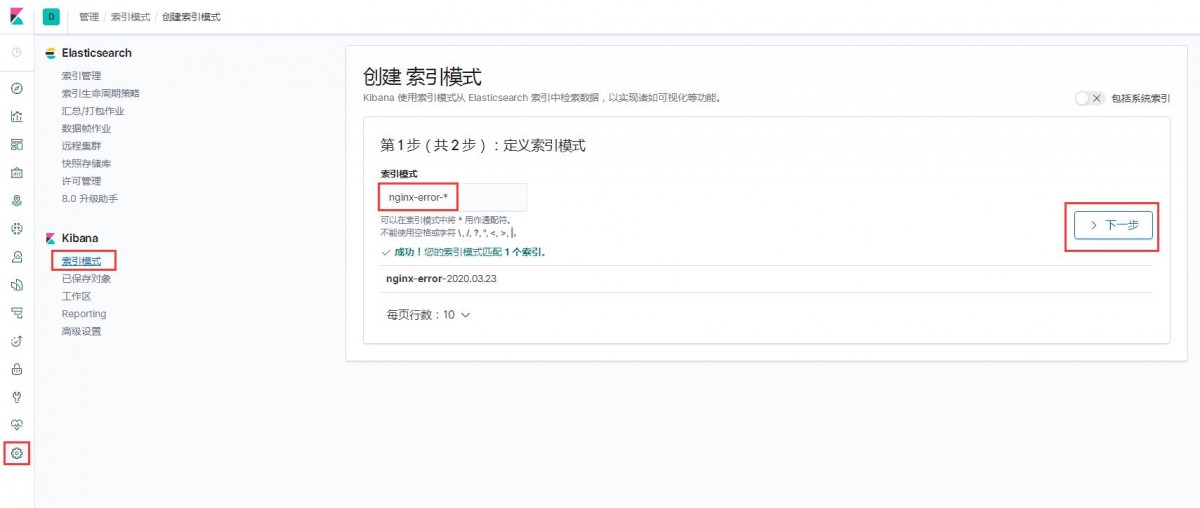
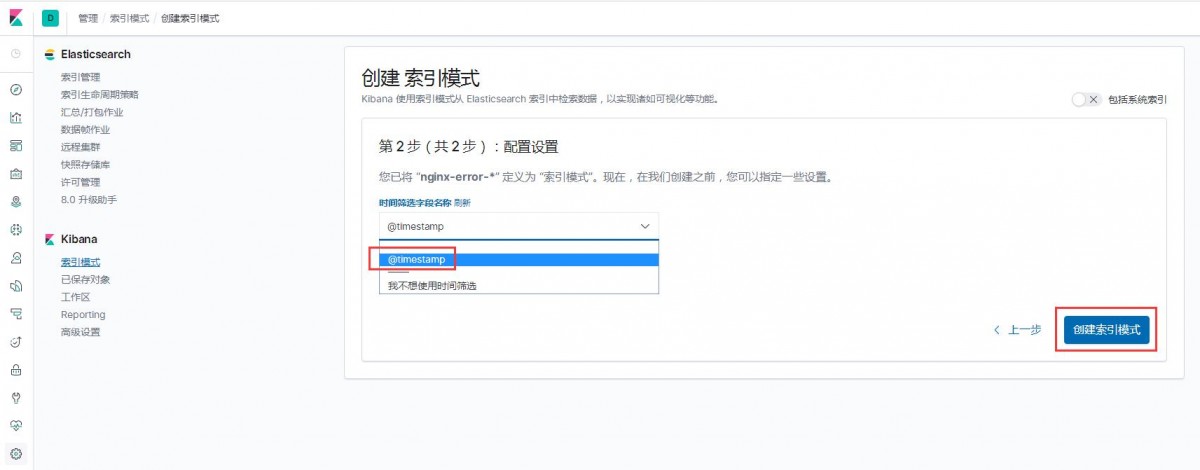
1)索引模式--->>创建索引模式,输入索引模式名称,点击下一步
2)配置设置,选择时间筛选字段名称--->>创建索引模式
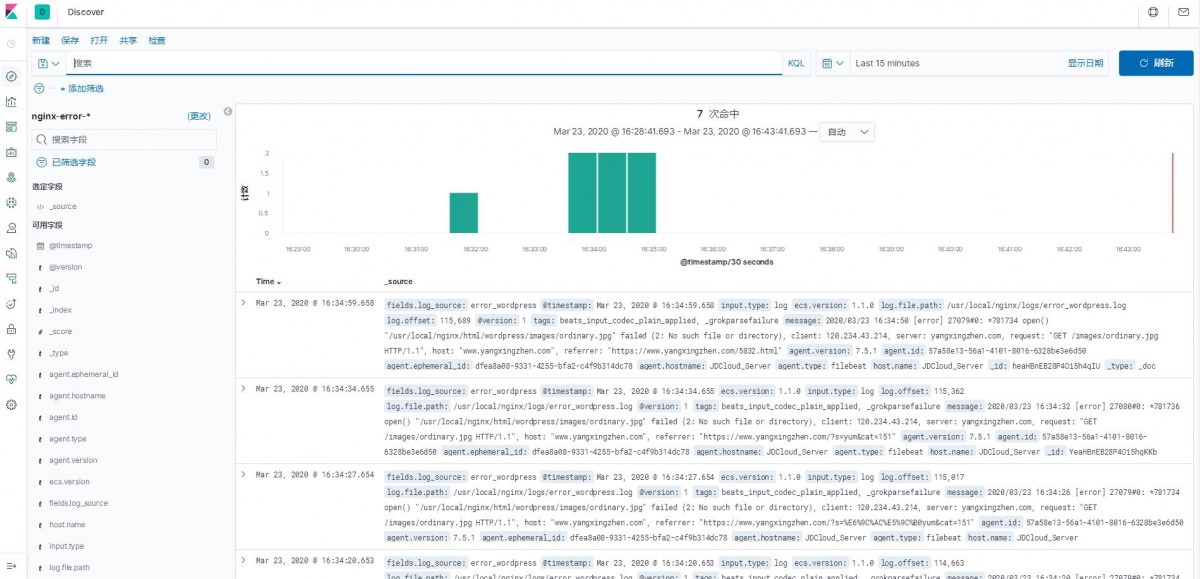
3)点击Discover,就能看到日志数据了,如下图
至此,ELK收集Nginx日志搭建完成。
若文章图片、下载链接等信息出错,请在评论区留言反馈,博主将第一时间更新!如本文“对您有用”,欢迎随意打赏,谢谢!


评论