
一、ELK简介
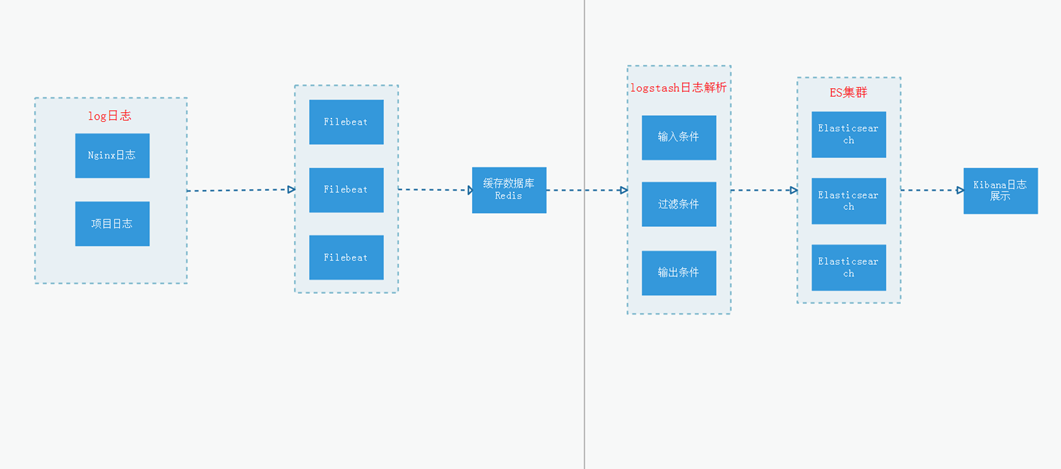
ELK是三个开源软件的缩写,分别表示:Elasticsearch , Logstash, Kibana , 它们都是开源软件。新增了一个FileBeat,它是一个轻量级的日志收集处理工具(Agent),Filebeat占用资源少,适合于在各个服务器上搜集日志后传输给Logstash,官方也推荐此工具。
1、Elasticsearch是个开源分布式搜索引擎,提供搜集、分析、存储数据三大功能。它的特点有:分布式,零配置,自动发现,索引自动分片,索引副本机制,restful风格接口,多数据源,自动搜索负载等。
2、Logstash主要是用来日志的搜集、分析、过滤日志的工具,支持大量的数据获取方式。一般工作方式为c/s架构,client端安装在需要收集日志的主机上,server端负责将收到的各节点日志进行过滤、修改等操作在一并发往elasticsearch上去。
3、Kibana也是一个开源和免费的工具,Kibana可以为Logstash和 ElasticSearch提供的日志分析友好的 Web 界面,可以帮助汇总、分析和搜索重要数据日志。
4、Filebeat隶属于Beats。目前Beats包含四种工具:
- Packetbeat(搜集网络流量数据)
- Topbeat(搜集系统、进程和文件系统级别的CPU和内存使用情况等数据)
- Filebeat(搜集文件数据)
- Winlogbeat(搜集Windows事件日志数据)
二、基础环境配置
1、EFK架构图
2、环境准备(集群节点分配)
|
主机名称 |
IP地址 |
操作系统 |
服务器配置 |
角色 |
|
master |
172.16.80.199 |
CentOS 7.9 |
CPU:8vCPU 内存:16GB |
ES节点1 |
|
node2 |
172.16.80.198 |
CentOS 7.9 |
CPU:8vCPU 内存:16GB |
ES节点2 |
|
node1 |
172.16.80.197 |
CentOS 7.9 |
CPU:8vCPU 内存:16GB |
ES节点3 |
|
Logstash |
172.16.80.200 |
CentOS 7.9 |
CPU:8vCPU 内存:16GB |
Logstash解析日志 |
|
Filebeat |
172.16.80.200 |
CentOS 7.9 |
CPU:8vCPU 内存:16GB |
Filebeat收集日志 |
|
Kibana |
172.16.80.200 |
CentOS 7.9 |
CPU:8vCPU 内存:16GB |
Kibana节点 |
|
Redis |
172.16.80.200 |
CentOS 7.9 |
CPU:8vCPU 内存:16GB |
Redis缓存数据库 |
3、软件版本
Elasticsearch:elasticsearch-7.17.7-x86_64.rpm
Kibana:kibana-7.17.7-x86_64.rpm
Logstash:logstash-7.17.7-x86_64.rpm
Filebeat:filebeat-7.17.7-x86_64.rpm
JDK:openjdk-11.0.17
Redis:redis-6.2.7.tar.gz
注:所有ES节点都需要执行
4、关闭防火墙和selinux
[root@localhost ~]# systemctl stop firewalld
[root@localhost ~]# systemctl disable firewalld
[root@localhost ~]# setenforce 0
[root@localhost ~]# sed -i '/SELINUX/s/enforcing/disabled/' /etc/selinux/config
5、内核优化
[root@localhost ~]# vim /etc/security/limits.conf
# 在文件最后添加以下内容
* soft nofile 65537
* hard nofile 65537
* soft nproc 65537
* hard nproc 65537
[root@localhost ~]# vim /etc/security/limits.d/20-nproc.conf
# 配置以下内容
* soft nproc 4096
[root@localhost ~]# vim /etc/sysctl.conf
# 配置以下内容
net.ipv4.tcp_max_syn_backlog = 65536
net.core.netdev_max_backlog = 32768
net.core.somaxconn = 32768
net.core.wmem_default = 8388608
net.core.rmem_default = 8388608
net.core.rmem_max = 16777216
net.core.wmem_max = 16777216
net.ipv4.tcp_timestamps = 0
net.ipv4.tcp_synack_retries = 2
net.ipv4.tcp_syn_retries = 2
net.ipv4.tcp_tw_recycle = 1
net.ipv4.tcp_tw_reuse = 1
net.ipv4.tcp_mem = 94500000 915000000 927000000
net.ipv4.tcp_max_orphans = 3276800
net.ipv4.tcp_fin_timeout = 120
net.ipv4.tcp_keepalive_time = 120
net.ipv4.ip_local_port_range = 1024 65535
net.ipv4.tcp_max_tw_buckets = 30000
fs.file-max=655350
vm.max_map_count = 262144
net.core.somaxconn= 65535
net.ipv4.ip_forward = 1
net.ipv6.conf.all.disable_ipv6=1
# 执行sysctl -p命令使其生效
[root@localhost ~]# sysctl -p
6、配置hosts文件
[root@master ~]# vim /etc/hosts
172.16.80.199	master
172.16.80.198	node2
172.16.80.197	node1
7、配置主机名
# master主机
[root@localhost ~]# hostnamectl set-hostname master
# node1主机
[root@localhost ~]# hostnamectl set-hostname node1
# node2主机
[root@localhost ~]# hostnamectl set-hostname node2
8、安装JDK环境
[root@localhost ~]# yum -y install java-11-openjdk
# 看到如下信息,JAVA环境安装成功
[root@localhost ~]# java -version
openjdk version "11.0.17" 2022-10-18 LTS
OpenJDK Runtime Environment (Red_Hat-11.0.17.0.8-2.el7_9) (build 11.0.17+8-LTS)
OpenJDK 64-Bit Server VM (Red_Hat-11.0.17.0.8-2.el7_9) (build 11.0.17+8-LTS, mixed mode, sharing)
三、安装Elasticsearch分布式集群
1、下载Elasticsearch安装包
[root@localhost ~]# wget https://artifacts.elastic.co/downloads/elasticsearch/elasticsearch-7.17.7-x86_64.rpm
2、安装Elasticsearch
[root@master ~]# yum -y install elasticsearch-7.17.7-x86_64.rpm
3、创建持久化目录及logs日志目录
[root@master ~]# mkdir -p /data/elasticsearch/{data,logs}
[root@master ~]# chown -R elasticsearch.elasticsearch /data/elasticsearch
4、修改elasticsearch.yml配置文件,文件内容如下
[root@master ~]# vim /etc/elasticsearch/elasticsearch.yml
# master
# 集群名称
cluster.name: es-cluster
# 节点名称
node.name: master
# 存放数据目录,先创建该目录
path.data: /data/elasticsearch/data
# 存放日志目录,先创建该目录
path.logs: /data/elasticsearch/logs
# 节点IP
network.host: master
# tcp端口
transport.tcp.port: 9300
# http端口
http.port: 9200
# 服务发现节点列表,若有多个节点,则节点进行对应的配置
discovery.seed_hosts: ["master:9300","node1:9300","node2:9300"]
# 初始主节点
cluster.initial_master_nodes: ["master","node1","node2"]
# 候选节点数
gateway.recover_after_nodes: 2
# 心跳超时时间
discovery.zen.ping_timeout: 60s
# 节点检测时间
discovery.zen.fd.ping_interval: 120s
# ping 超时时间
discovery.zen.fd.ping_timeout: 120s
discovery.zen.fd.ping_retries: 3
# 是否允许作为主节点
node.master: true
# 是否保存数据
node.data: true
node.ingest: false
node.ml: false
cluster.remote.connect: false
# 跨域
http.cors.enabled: true
http.cors.allow-origin: "*"
[root@node1 ~]# vim /etc/elasticsearch/elasticsearch.yml
# node1
# 集群名称
cluster.name: es-cluster
# 节点名称
node.name: node1
# 存放数据目录,先创建该目录
path.data: /data/elasticsearch/data
# 存放日志目录,先创建该目录
path.logs: /data/elasticsearch/logs
# 节点IP
network.host: node1
# tcp端口
transport.tcp.port: 9300
# http端口
http.port: 9200
# 服务发现节点列表,若有多个节点,则节点进行对应的配置
discovery.seed_hosts: ["master:9300","node1:9300","node2:9300"]
# 初始主节点
cluster.initial_master_nodes: ["master","node1","node2"]
# 候选节点数
gateway.recover_after_nodes: 2
# 心跳超时时间
discovery.zen.ping_timeout: 60s
# 节点检测时间
discovery.zen.fd.ping_interval: 120s
# ping 超时时间
discovery.zen.fd.ping_timeout: 120s
discovery.zen.fd.ping_retries: 3
# 是否允许作为主节点
node.master: true
# 是否保存数据
node.data: true
node.ingest: false
node.ml: false
cluster.remote.connect: false
# 跨域
http.cors.enabled: true
http.cors.allow-origin: "*"
[root@node2 ~]# vim /etc/elasticsearch/elasticsearch.yml
# node2
# 集群名称
cluster.name: es-cluster
# 节点名称
node.name: node2
# 存放数据目录,先创建该目录
path.data: /data/elasticsearch/data
# 存放日志目录,先创建该目录
path.logs: /data/elasticsearch/logs
# 节点IP
network.host: node2
# tcp端口
transport.tcp.port: 9300
# http端口
http.port: 9200
# 服务发现节点列表,若有多个节点,则节点进行对应的配置
discovery.seed_hosts: ["master:9300","node1:9300","node2:9300"]
# 初始主节点
cluster.initial_master_nodes: ["master","node1","node2"]
# 候选节点数
gateway.recover_after_nodes: 2
# 心跳超时时间
discovery.zen.ping_timeout: 60s
# 节点检测时间
discovery.zen.fd.ping_interval: 120s
# ping 超时时间
discovery.zen.fd.ping_timeout: 120s
discovery.zen.fd.ping_retries: 3
# 是否允许作为主节点
node.master: true
# 是否保存数据
node.data: true
node.ingest: false
node.ml: false
cluster.remote.connect: false
# 跨域
http.cors.enabled: true
http.cors.allow-origin: "*"
7、启动Elasticsearch服务
[root@master ~]# systemctl start elasticsearch
8、查询ES的集群状态
# 第一种
[root@master ~]# curl -XGET 'http://master:9200/_cat/nodes'
172.16.80.198 42 97 2 0.68 0.66 0.34 cdfhmstw * node2
172.16.80.199 16 96 2 0.17 0.30 0.20 cdfhmstw - master
172.16.80.197 16 96 1 0.46 0.52 0.29 cdfhmstw - node1
[root@master ~]# curl -XGET 'http://node1:9200/_cat/nodes'
172.16.80.197 17 96 3 0.42 0.51 0.29 cdfhmstw - node1
172.16.80.198 44 96 1 0.63 0.65 0.34 cdfhmstw * node2
172.16.80.199 16 96 2 0.16 0.29 0.20 cdfhmstw - master
[root@master ~]# curl -XGET 'http://node2:9200/_cat/nodes'
172.16.80.199 17 96 3 0.16 0.29 0.20 cdfhmstw - master
172.16.80.197 17 96 6 0.39 0.50 0.29 cdfhmstw - node1
172.16.80.198 45 96 5 0.63 0.65 0.34 cdfhmstw * node2
# 带*号的是通过选举出来的master
# 第二种
[root@master ~]# curl -X GET 'http://master:9200/_cluster/health?pretty'
{
"cluster_name" : "es-cluster",
"status" : "green",
"timed_out" : false,
"number_of_nodes" : 3,
"number_of_data_nodes" : 3,
"active_primary_shards" : 3,
"active_shards" : 6,
"relocating_shards" : 0,
"initializing_shards" : 0,
"unassigned_shards" : 0,
"delayed_unassigned_shards" : 0,
"number_of_pending_tasks" : 0,
"number_of_in_flight_fetch" : 0,
"task_max_waiting_in_queue_millis" : 0,
"active_shards_percent_as_number" : 100.0
}
四、配置X-Pack认证
1、配置SSL并启用X-Pack
1.1、X-pack是什么?
X-Pack是Elastic Stack扩展功能,提供安全性,警报,监视,报告,机器学习和许多其他功能。ES7.0+之后,默认情况下,当安装Elasticsearch时,会安装X-Pack,无需单独再安装。
自6.8以及7.1+版本之后,基础级安全永久免费。
基础版本安全功能列表如下:
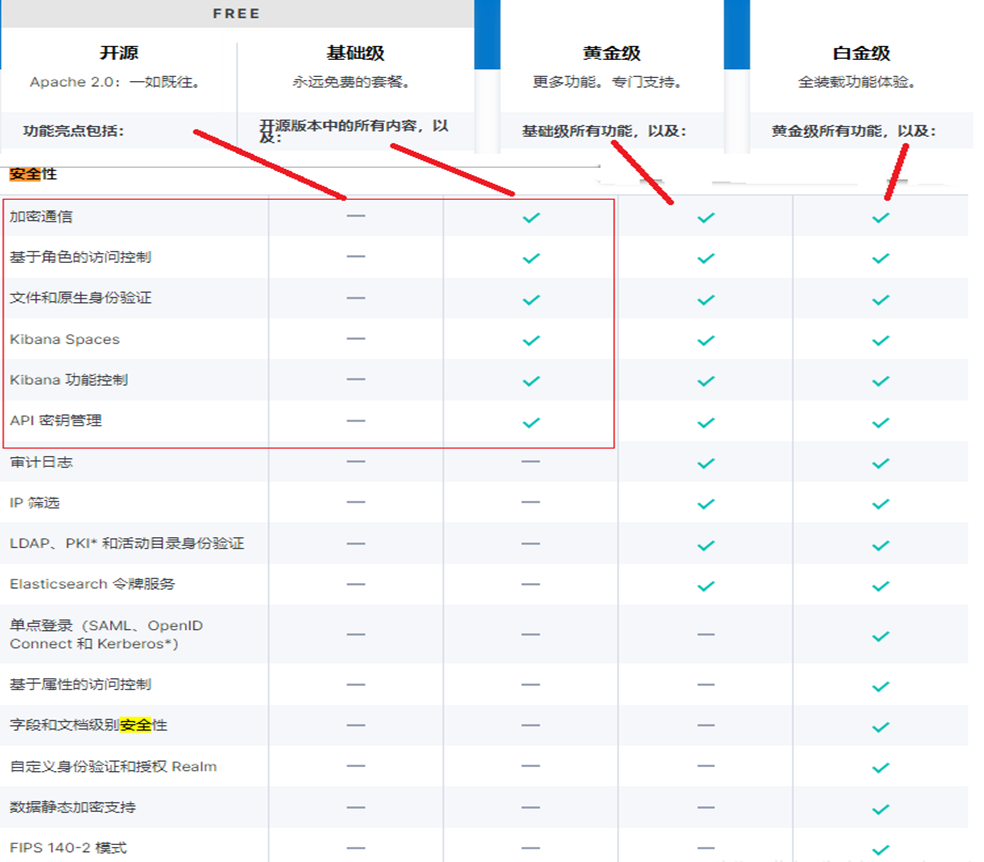
X-Pack安全配置的核心四步骤:
1)设置:xpack.security.enabled: true。
2)生成TLS证书。
3)配置加密通信。
4)设置密码。
1.2、生成节点证书
1)证书实现加密通信的原理
TLS需要X.509证书(X.509 证书是一个数字证书,它使用X.509公有密钥基础设施标准将公有密钥与证书中包含的身份相关联。X.509证书由一家名为证书颁发机构(CA)的可信实体颁发。CA 持有一个或多个名为CA证书的特殊证书,它使用这种证书来颁发X.509证书。只有证书颁发机构才有权访问CA证书)才能对与之通信的应用程序执行加密和身份验证。为了使节点之间的通信真正安全,必须对证书进行验证。
在Elasticsearch集群中验证证书真实性的推荐方法是信任签署证书的证书颁发机构(CA)。这样只需要使用由同一CA签名的证书,即可自动允许该节点加入集群。
2)借助elasticsearch-certutil命令生成证书
[root@master ~]# /usr/share/elasticsearch/bin/elasticsearch-certutil ca -out /etc/elasticsearch/elastic-certificates.p12 -pass "www.yangxingzhen.com"
This tool assists you in the generation of X.509 certificates and certificate
signing requests for use with SSL/TLS in the Elastic stack.
The 'ca' mode generates a new 'certificate authority'
This will create a new X.509 certificate and private key that can be used
to sign certificate when running in 'cert' mode.
Use the 'ca-dn' option if you wish to configure the 'distinguished name'
of the certificate authority
By default the 'ca' mode produces a single PKCS#12 output file which holds:
* The CA certificate
* The CA's private key
If you elect to generate PEM format certificates (the -pem option), then the output will
be a zip file containing individual files for the CA certificate and private key
3)将证书拷贝到其他节点,放入/etc/elasticsearch/目录下
[root@master ~]# scp /etc/elasticsearch/elastic-certificates.p12 root@node1:/etc/elasticsearch/
[root@master ~]# scp /etc/elasticsearch/elastic-certificates.p12 root@node2:/etc/elasticsearch/
4)配置加密通信
# 启用安全功能后,必须使用TLS来确保节点之间的通信已加密。
在elasticsearch.yml新增配置如下:(其他节点相同配置)
[root@master ~]# vim /etc/elasticsearch/elasticsearch.yml
# 配置X-Pack
http.cors.allow-headers: Authorization
xpack.security.enabled: true
xpack.security.transport.ssl.enabled: true
xpack.security.transport.ssl.verification_mode: certificate
xpack.security.transport.ssl.keystore.path: elastic-certificates.p12
xpack.security.transport.ssl.truststore.path: elastic-certificates.p12
5)创建证书时输入了密码,那可以通过下面的方法设置。(所有节点需要执行)
# 输入生成证书的密码即可
# master
[root@master ~]# /usr/share/elasticsearch/bin/elasticsearch-keystore add xpack.security.transport.ssl.keystore.secure_password
[root@master ~]# /usr/share/elasticsearch/bin/elasticsearch-keystore add xpack.security.transport.ssl.truststore.secure_password
# node1
[root@node1 ~]# /usr/share/elasticsearch/bin/elasticsearch-keystore add xpack.security.transport.ssl.keystore.secure_password
[root@node1 ~]# /usr/share/elasticsearch/bin/elasticsearch-keystore add xpack.security.transport.ssl.truststore.secure_password
# node2
[root@node2 ~]# /usr/share/elasticsearch/bin/elasticsearch-keystore add xpack.security.transport.ssl.keystore.secure_password
[root@node2 ~]# /usr/share/elasticsearch/bin/elasticsearch-keystore add xpack.security.transport.ssl.truststore.secure_password
6)重启Elasticsearch
# 配置为使用TLS的节点无法与使用未加密网络的节点通信(反之亦然)。启用TLS后,必须重新启动所有节点才能保持群集之间的通信。
# 所有节点执行
[root@master ~]# chown -R elasticsearch.elasticsearch /etc/elasticsearch/elastic-certificates.p12
[root@master ~]# systemctl restart elasticsearch
1.3、设置Elasticsearch访问密码
# 生成密码有如下两种方式
auto - 随机生成密码。
interactive - 自定义不同用户的密码。
注意:必须配置好X-pack之后,才能设置密码。否则会报错。
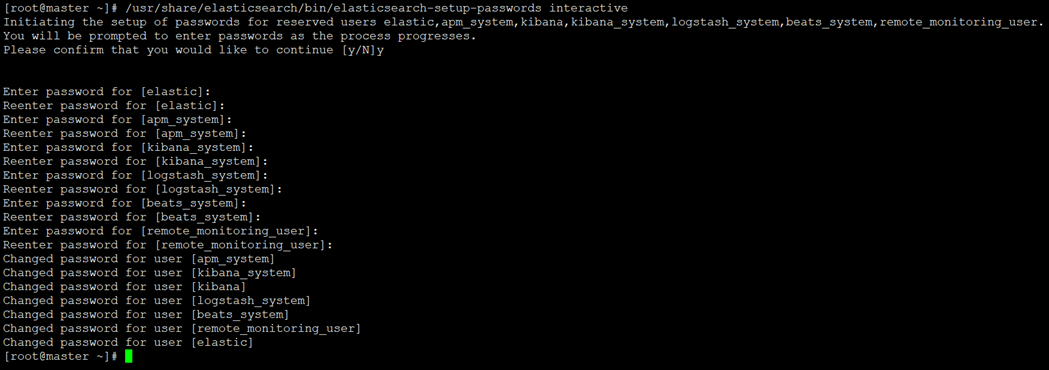
# 这里采用自定义密码方式
注:这里为了方便演示,密码统一设置为www.yangxingzhen.com
[root@master ~]# /usr/share/elasticsearch/bin/elasticsearch-setup-passwords interactive
注:配置了密码之后获取集群状态命令如下
[root@master ~]# curl --user elastic:www.yangxingzhen.com -X GET 'http://master:9200/_cluster/health?pretty'
{
"cluster_name" : "es-cluster",
"status" : "green",
"timed_out" : false,
"number_of_nodes" : 3,
"number_of_data_nodes" : 3,
"active_primary_shards" : 4,
"active_shards" : 8,
"relocating_shards" : 0,
"initializing_shards" : 0,
"unassigned_shards" : 0,
"delayed_unassigned_shards" : 0,
"number_of_pending_tasks" : 0,
"number_of_in_flight_fetch" : 0,
"task_max_waiting_in_queue_millis" : 0,
"active_shards_percent_as_number" : 100.0
}
1.4、Elasticsearch常用命令
curl -XDELETE 'http://master:9200/test-*' # 删除索引(后面为索引名称)
curl -XGET 'master:9200/_cat/health?v&pretty' # 查看集群状态
curl -XGET 'master:9200/_cat/indices?v&pretty' # 查看索引
五、安装Kibana
1、下载Kibana软件包
[root@localhost ~]$ wget https://artifacts.elastic.co/downloads/kibana/kibana-7.17.7-x86_64.rpm
2、安装Kibana
[root@localhost ~]# yum -y install kibana-7.17.7-x86_64.rpm
3、配置Kibana配置文件
[root@localhost ~]$ vim /etc/kibana/kibana.yml
# 配置内容如下
# 配置kibana的端口
server.port: 5601
# 配置监听ip
server.host: "172.16.80.200"
# 配置es服务器的ip,如果是集群则配置该集群中主节点的ip
elasticsearch.hosts: ["http://172.16.80.199:9200"]
elasticsearch.username: "elastic"
elasticsearch.password: "www.yangxingzhen.com"
# 配置kibana的日志文件路径,不然默认是messages里记录日志
logging.dest: /var/log/kibana/kibana.log
# 配置为中文
i18n.locale: "zh-CN"
4、启动Kibana
[root@localhost ~]# systemctl start kibana
六、部署Redis
1、下载Redis安装包
[root@localhost ~]# yum -y install wget gcc gcc-c++
[root@localhost ~]# wget https://download.redis.io/releases/redis-6.2.7.tar.gz
2、解压软件包
[root@localhost ~]# tar xf redis-6.2.7.tar.gz
3、编译安装
[root@localhost ~]# cd redis-6.2.7
[root@localhost redis-6.2.7]# make install PREFIX=/usr/local/redis
4、创建Redis配置文件
[root@localhost redis-6.2.7]# mkdir /etc/redis
[root@localhost redis-6.2.7]# vim /etc/redis/redis.conf
# 绑定IP地址
bind 0.0.0.0
# 监听端口
port 6379
# 自定义密码
requirepass "Aa123456"
# 超时时间
timeout 0
# 后台运行
daemonize yes
dbfilename "dump.rdb"
dir "/data/redis"
appendonly yes
save 3600 1
save 300 100
save 60 10000
pidfile "/var/run/redis.pid"
logfile "/tmp/redis.log"
appendfsync everysec
5、创建数据目录
[root@localhost redis-6.2.7]# mkdir -p /data/redis
6、启动Redis
[root@localhost redis-6.2.7]# /usr/local/redis/bin/redis-server /etc/redis/redis.conf
7、查看Redis是否启动成功
[root@localhost redis-6.2.7]# netstat -lntup |grep 6379
七、安装Filebeat
1、下载Filebeat软件包
[root@localhost ~]# wget https://artifacts.elastic.co/downloads/beats/filebeat/filebeat-7.17.7-x86_64.rpm
2、安装Filebeat
[root@localhost ~]# yum -y install filebeat-7.17.7-x86_64.rpm
3、编辑filebeat.yml配置文件,配置内容如下
[root@localhost ~]# vim /etc/filebeat/filebeat.yml
#========= Filebeat inputs ==========
filebeat.inputs:
- type: log
  enabled: true
  paths:
    - /var/log/messages
  multiline:
      pattern: '\d{1,2}:\d{1,2}:\d{1,2}'
      negate: true
      match: after
  fields:
    logtype: system-messages-log
output.redis:
  enabled: true
  hosts: ["172.16.80.200:6379"]
  password: "Aa123456"
  key: "system-access-log"
  db: 0
  timeout: 10
4、启动filebeat服务
[root@localhost ~]# systemctl start filebeat
八、安装Logstash
1、安装Openjdk-11
[root@localhost ~]# yum -y install java-11-openjdk
2、下载Logstash软件包
[root@localhost ~]# wget https://artifacts.elastic.co/downloads/logstash/logstash-7.17.7-x86_64.rpm
3、安装Logstash
[root@localhost ~]# yum -y install logstash-7.17.7-x86_64.rpm
4、编辑logstash.conf配置文件,配置内容如下
[root@localhost ~]# vim /etc/logstash/conf.d/logstash.conf
input {
    redis {
        host => "172.16.80.200"
        port => "6379"
        db => "0"
        password => "Aa123456"
        data_type => "list"
        key => "system-access-log"
        codec => "json"
    }
}

filter {
        if [fields][logtype] == "system-messages-log" {
        json {
            source => "message"
        }

        grok {
            match => { "message" => "%{TIMESTAMP_ISO8601:timestamp} %{LOGLEVEL:level}" }
        }

        date {
            match => ["timestamp", "yyyy-MM-dd HH:mm:ss,SSS"]
            target => "@timestamp"
        }
    }
}

output {
    if [fields][logtype] == "system-messages-log" {
        elasticsearch {
            hosts => ["172.16.80.199:9200"]
            user => "elastic"
            password => "www.yangxingzhen.com"
            action => "index"
            index => "system-messages-log-%{+YYYY.MM.dd}"
        }
    }
}
注意:比如按天的索引,就是索引名后面跟-%{+YYYY-MM-dd},如果想改成按照月的索引,那就是-%{+YYYY-MM}。不同内容的索引,定义的方式应该也是不同的。
4、启动filebeat服务
[root@localhost ~]# systemctl start logstash
九、访问Kibana
1、浏览器访问:http://172.16.80.200:5601,出现如下界面
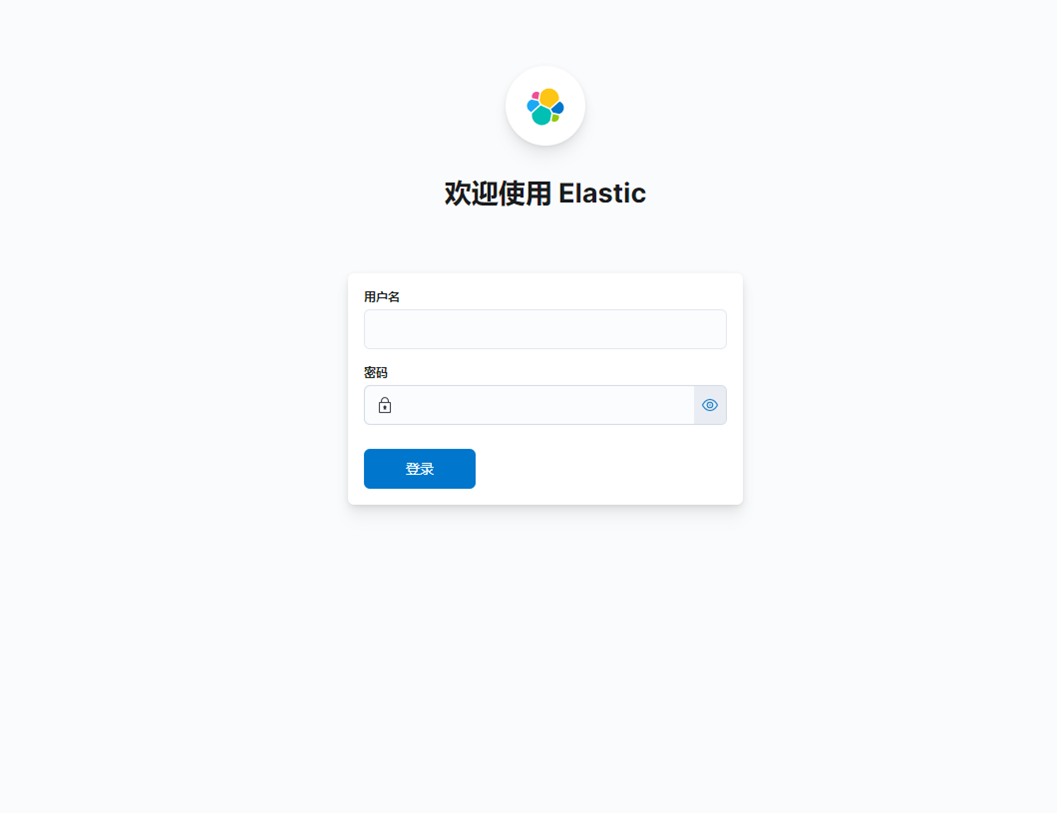
2、输入前面设置的用户名和密码,出现如下界面
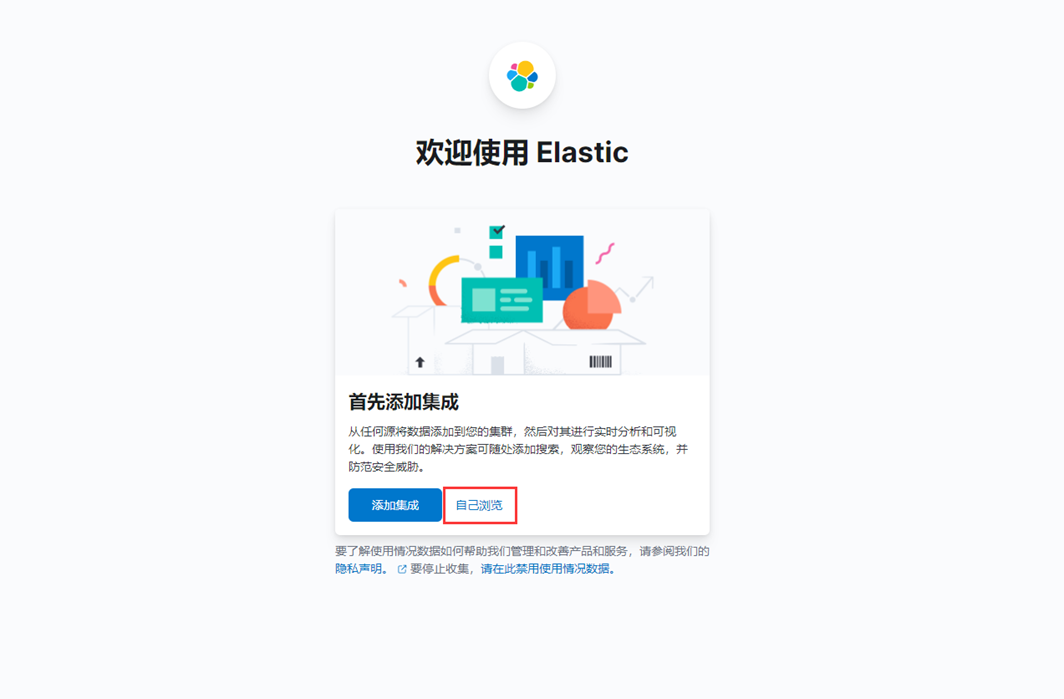
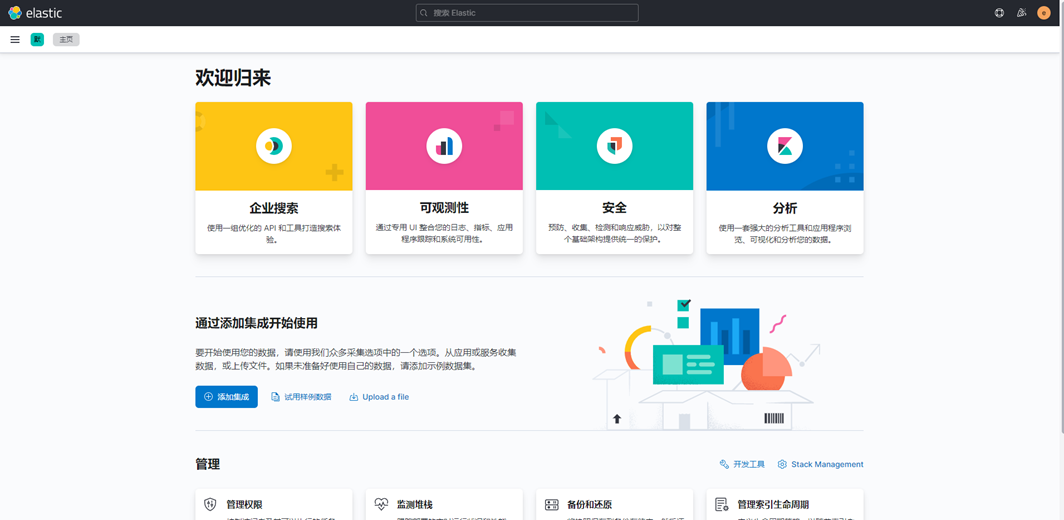
3、选择自己浏览,出现以下界面
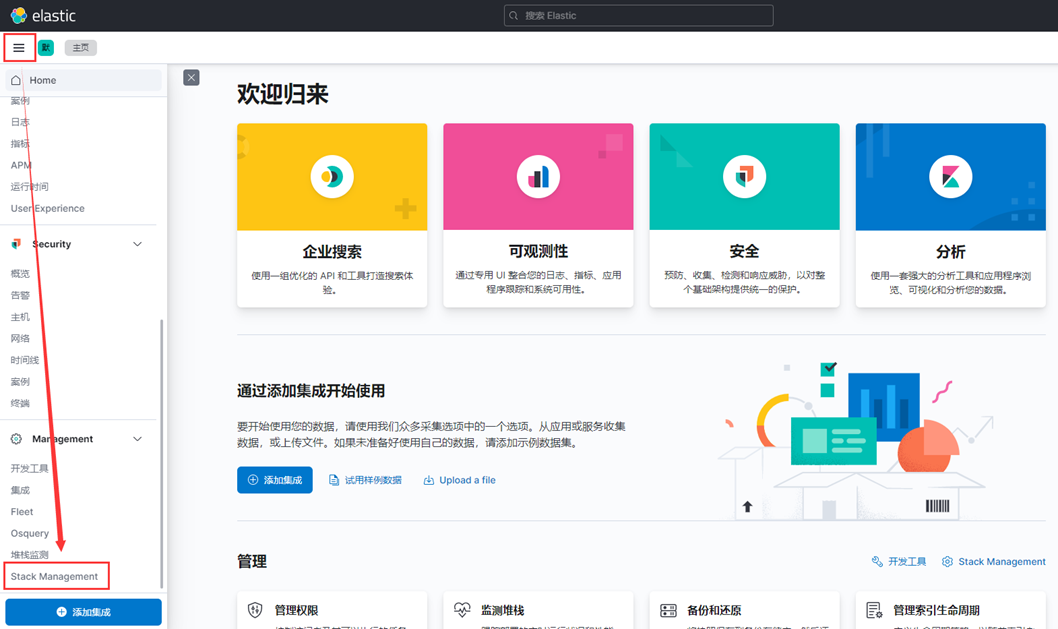
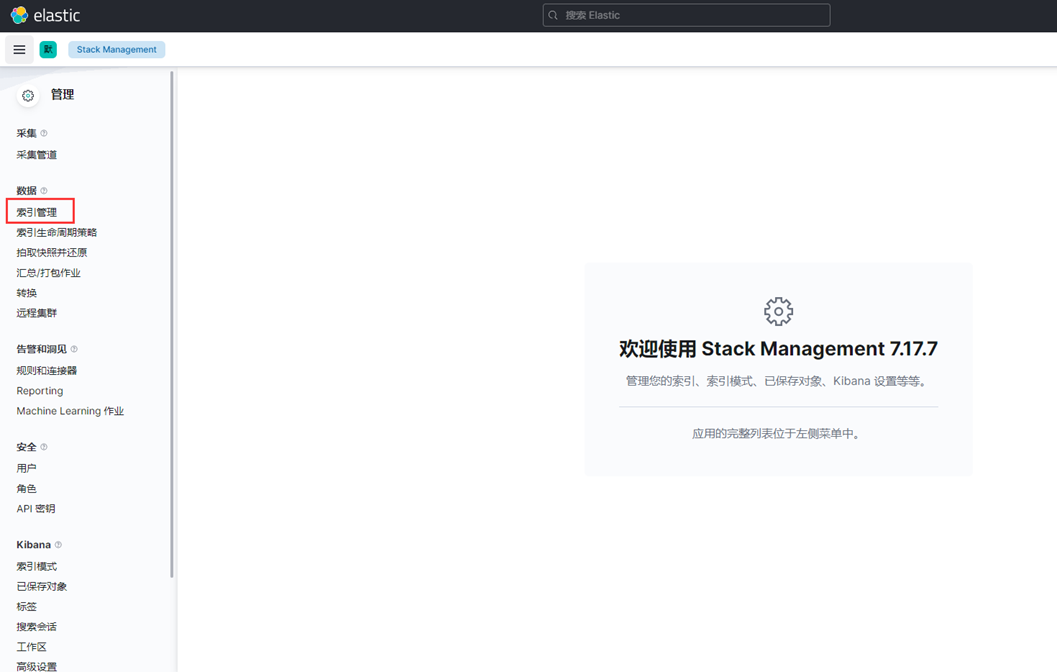
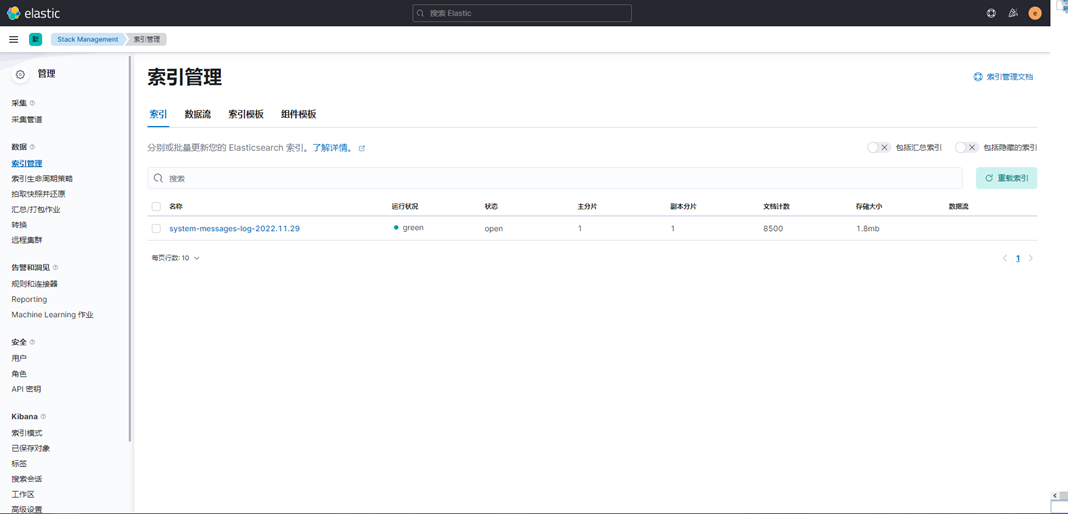
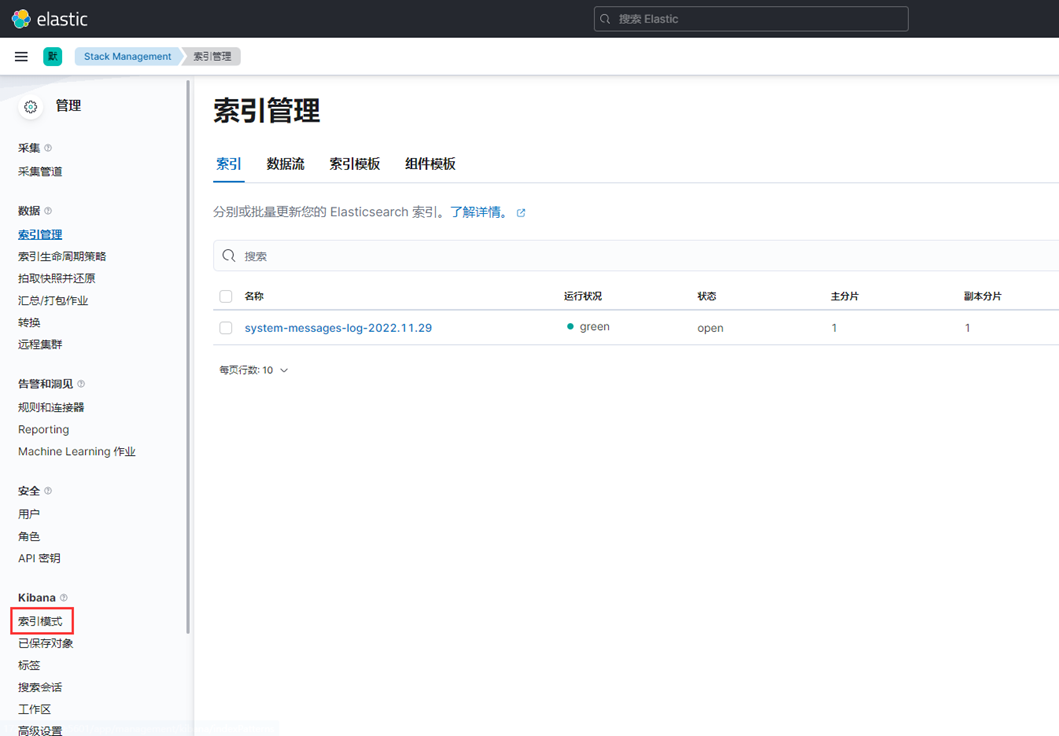
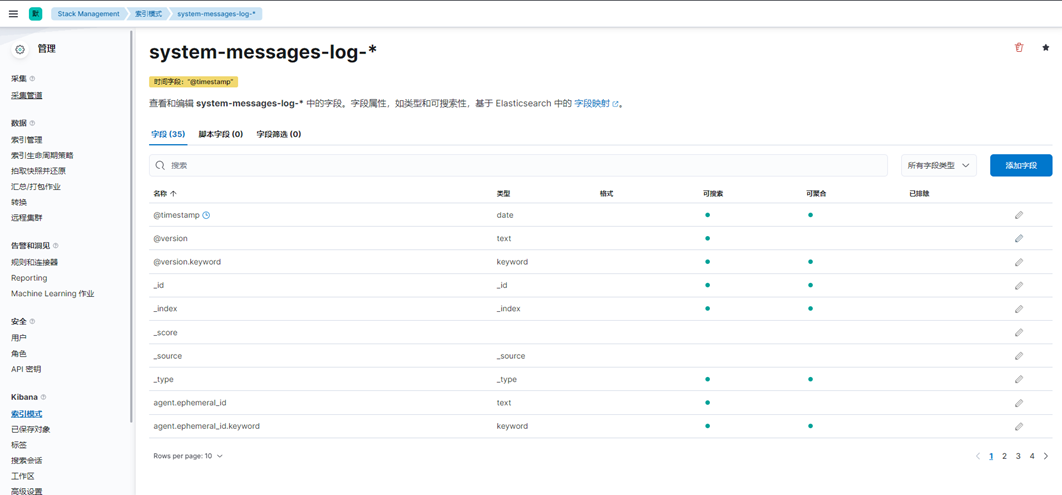
4、点击索引管理,这时候就能看到索引信息
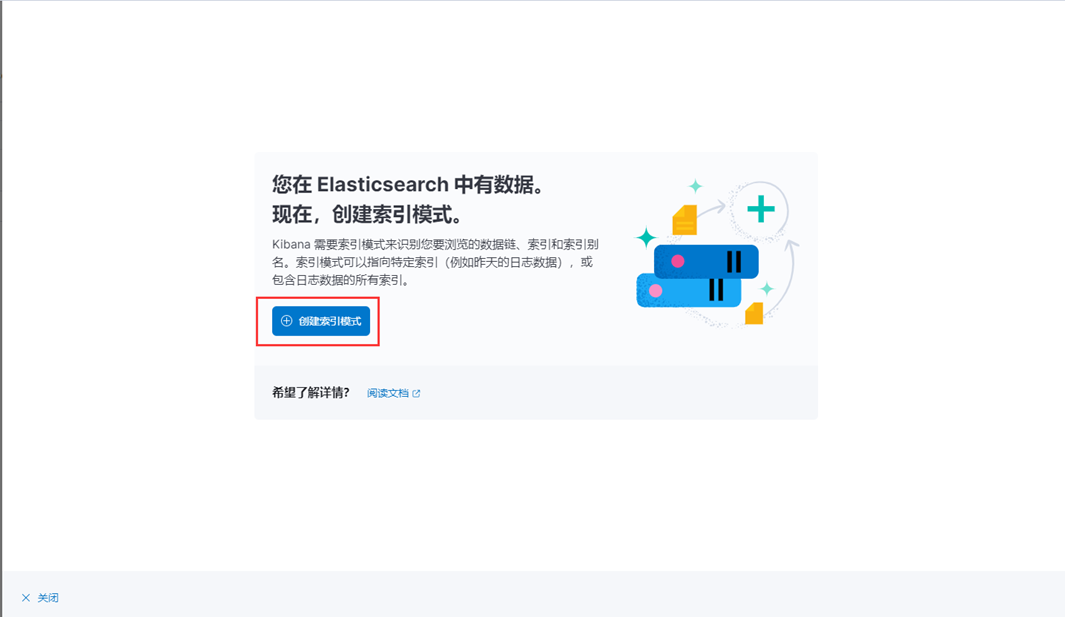
5、创建索引模式
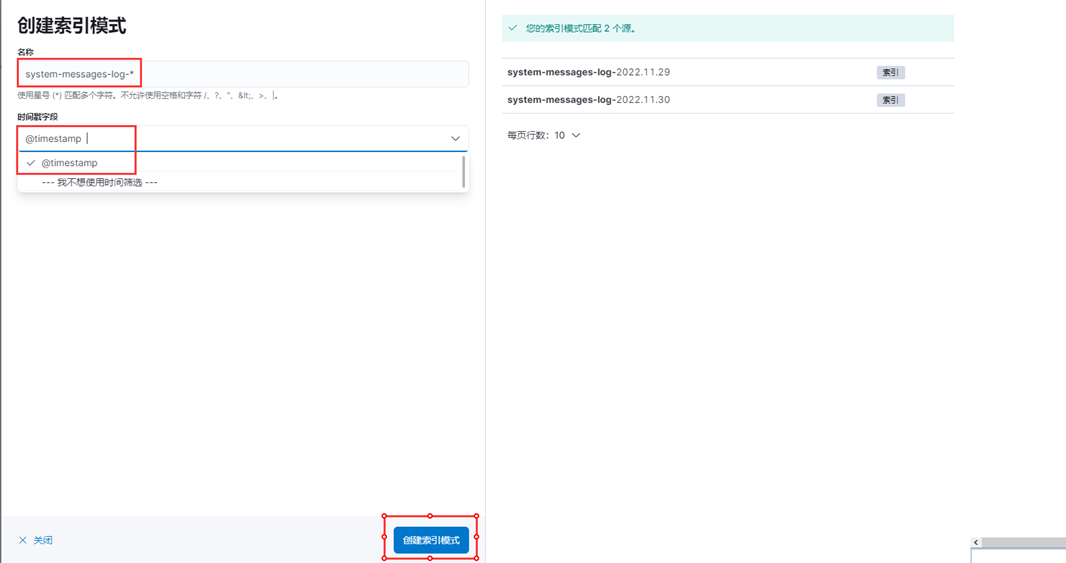
6、输入索引模式名称及时间戳字段(可选),点击创建索引模式
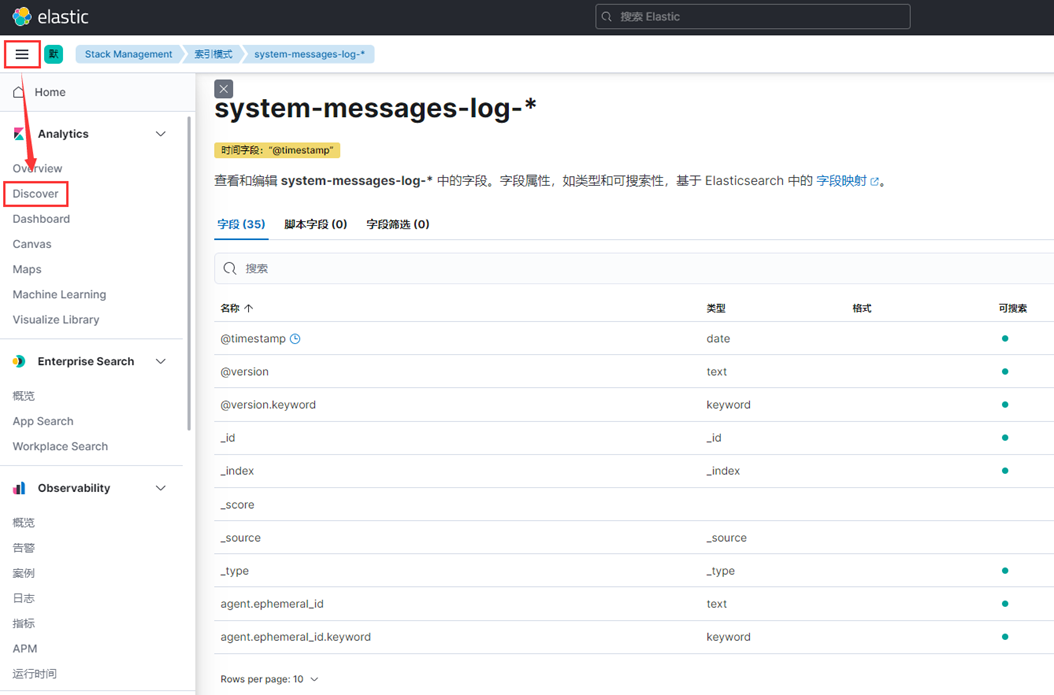
7、点击Discover,就能看到日志数据了,如下图
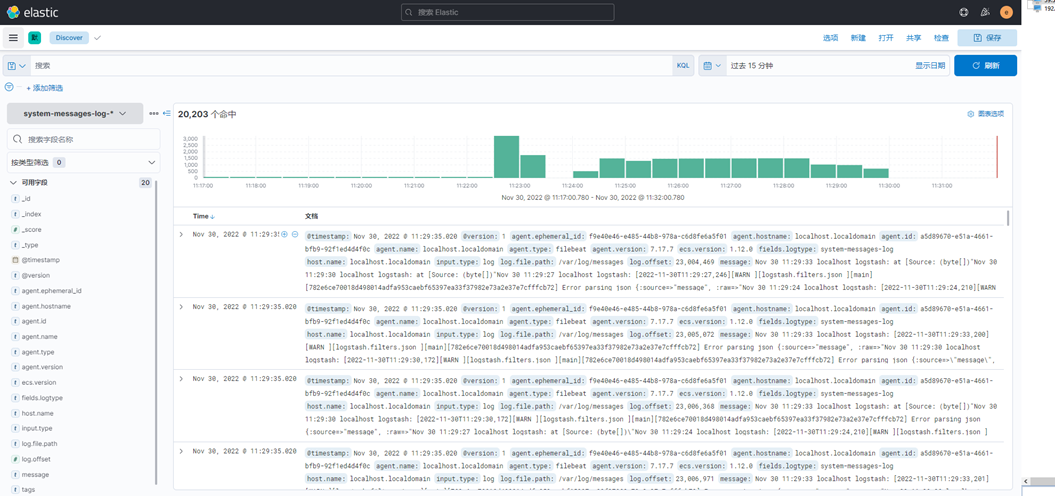
至此,ELK日志分析平台收集messages日志搭建完成。
若文章图片、下载链接等信息出错,请在评论区留言反馈,博主将第一时间更新!如本文“对您有用”,欢迎随意打赏,谢谢!


评论