
一、Prometheus简介
Prometheus是由SoundCloud开发的开源监控报警系统和时序列数据库(TSDB)。Prometheus使用Go语言开发,是Google BorgMon监控系统的开源版本。
Prometheus的特点
- 多维度数据模型。
- 灵活的查询语言。
- 不依赖分布式存储,单个服务器节点是自主的。
- 通过基于HTTP的pull方式采集时序数据。
- 可以通过中间网关进行时序列数据推送。
- 通过服务发现或者静态配置来发现目标服务对象。
- 支持多种多样的图表和界面展示,比如Grafana等
二、Prometheus服务发现类型
除静态配置之外,Prometheus已经支持了如下的服务发现方式
# List of Azure service discovery configurations.
azure_sd_configs:
  [ - <azure_sd_config> ... ]

# List of Consul service discovery configurations.
consul_sd_configs:
  [ - <consul_sd_config> ... ]

# List of DNS service discovery configurations.
dns_sd_configs:
  [ - <dns_sd_config> ... ]

# List of EC2 service discovery configurations.
ec2_sd_configs:
  [ - <ec2_sd_config> ... ]

# List of OpenStack service discovery configurations.
openstack_sd_configs:
  [ - <openstack_sd_config> ... ]

# List of file service discovery configurations.
file_sd_configs:
  [ - <file_sd_config> ... ]

# List of GCE service discovery configurations.
gce_sd_configs:
  [ - <gce_sd_config> ... ]

# List of Kubernetes service discovery configurations.
kubernetes_sd_configs:
  [ - <kubernetes_sd_config> ... ]

# List of Marathon service discovery configurations.
marathon_sd_configs:
  [ - <marathon_sd_config> ... ]

# List of AirBnB's Nerve service discovery configurations.
nerve_sd_configs:
  [ - <nerve_sd_config> ... ]

# List of Zookeeper Serverset service discovery configurations.
serverset_sd_configs:
  [ - <serverset_sd_config> ... ]

# List of Triton service discovery configurations.
triton_sd_configs:
  [ - <triton_sd_config> ... ]
三、Prometheus服务发现配置
1、静态服务发现(static_configs)
- job_name: "nodes"
static_configs:
- targets:
- 192.168.11.199:9100
- 192.168.11.198:9100
- 192.168.11.197:9100
2、基于文件服务发现(file_sd_configs)
在Prometheus支持的众多服务发现的实现方式中,基于文件的服务发现是最通用的方式。这种方式不需要依赖于任何的平台或者第三方服务。对于Prometheus而言也不可能支持所有的平台或者环境。通过基于文件的服务发现方式下,Prometheus会定时从文件中读取最新的Target信息,因此,你可以通过任意的方式将监控Target的信息写入即可。
用户可以通过JSON或者YAML格式的文件,定义所有的监控目标。
例子:
1)yaml格式
1、配置prometheus.yml
[root@localhost ~]# vim /usr/local/prometheus/prometheus.yml
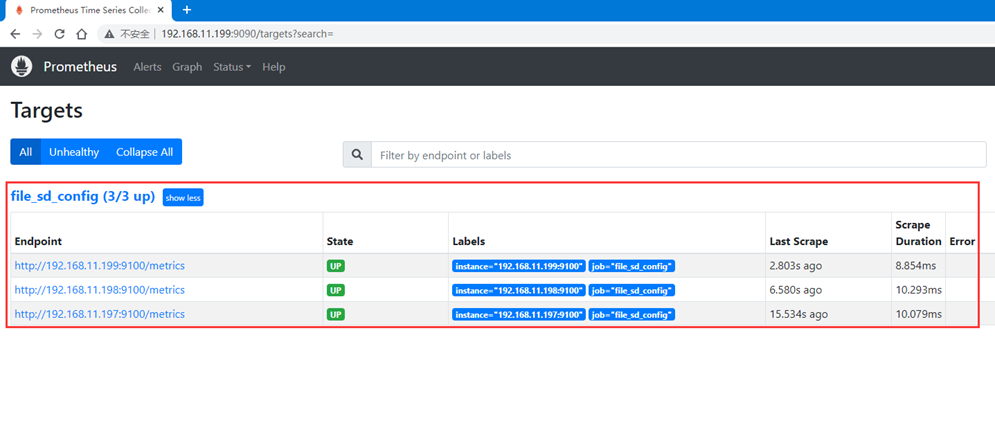
- job_name: "file_sd_config"  # 定义服务发现采集任务名称
    file_sd_configs:
      - files:
        - targets/node.yml    # 采集路径文件
        refresh_interval: 1m  # 服务发现采集间隔时间,默认5分钟
2、创建文件发现存储目录
[root@localhost ~]# mkdir -p /usr/local/prometheus/targets
3、编辑node.yml
[root@localhost ~]# vim /usr/local/prometheus/targets/node.yml
- targets:
    - '192.168.11.199:9100'
    - '192.168.11.198:9100'
    - '192.168.11.197:9100'
4、Prometheus热加载
[root@localhost ~]# curl -X POST http://localhost:9090/-/reload
5、验证数据
2)json格式
1、配置prometheus.yml
[root@localhost ~]# vim /usr/local/prometheus/prometheus.yml
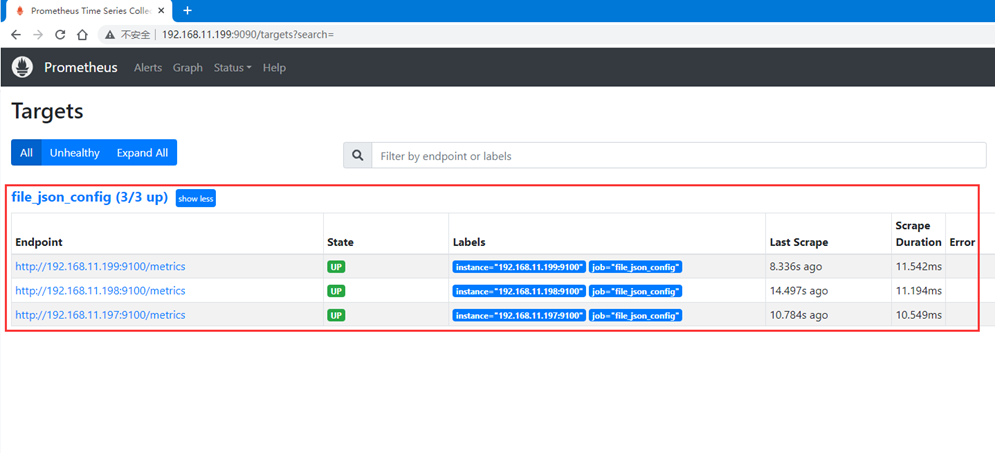
- job_name: "file_json_config"  # 定义服务发现采集任务名称
    file_sd_configs:
      - files:
        - targets/node.json   # 采集路径文件
        refresh_interval: 1m  # 服务发现采集间隔时间,默认5分钟
2、创建文件发现存储目录
[root@localhost ~]# mkdir -p /usr/local/prometheus/targets
3、编辑node.json
[root@localhost ~]# vim /usr/local/prometheus/targets/node.json
[
  {
    "targets": ["192.168.11.199:9100","192.168.11.198:9100","192.168.11.197:9100"]
  }
]
4、Prometheus热加载
[root@localhost ~]# curl -X POST http://localhost:9090/-/reload
5、验证数据
3、基于Consul注册中心服务发现
1、consul简介
consul是google开源的一个使用go语言开发的服务发现、配置管理中心服务。内置了服务注册与发现框架、分布一致性协议实现、健康检查、Key/Value存储、多数据中心方案,不再需要依赖其他工具(比如ZooKeeper等)。
2、部署Consul(已部署可忽略)
[root@localhost ~]# yum install -y yum-utils
[root@localhost ~]# yum-config-manager --add-repo https://rpm.releases.hashicorp.com/RHEL/hashicorp.repo
[root@localhost ~]# yum -y install consul
3、检查Consul是否安装成功
[root@localhost ~]# consul version
Consul v1.15.2
Revision 5e08e229
Build Date 2023-03-30T17:51:19Z
Protocol 2 spoken by default, understands 2 to 3 (agent will automatically use protocol >2 when speaking to compatible agents)
4、配置Consul
[root@localhost ~]# vim /etc/consul.d/consul.hcl
# 数据中心名称
datacenter = "consul-cluster"
# 数据目录
data_dir = "/opt/consul"
# 指定客户端访问的IP,0.0.0.0不限制客户端IP
client_addr = "0.0.0.0"
# 开启UI
ui_config{
  enabled = true
}
# Agent以服务端模式启动(注册中心)
server = true
# 监听所有地址
bind_addr = "0.0.0.0"
# 部署1个server节点
bootstrap_expect=1
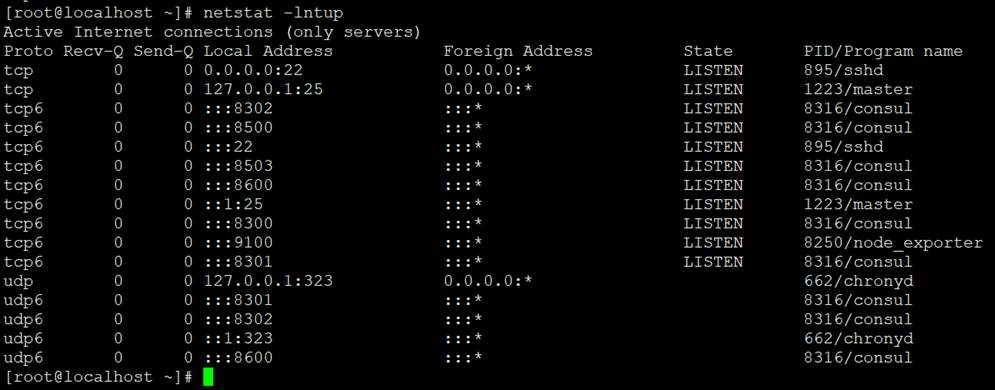
5、启动Consul
[root@localhost ~]# systemctl start consul
[root@localhost ~]# netstat -lntup
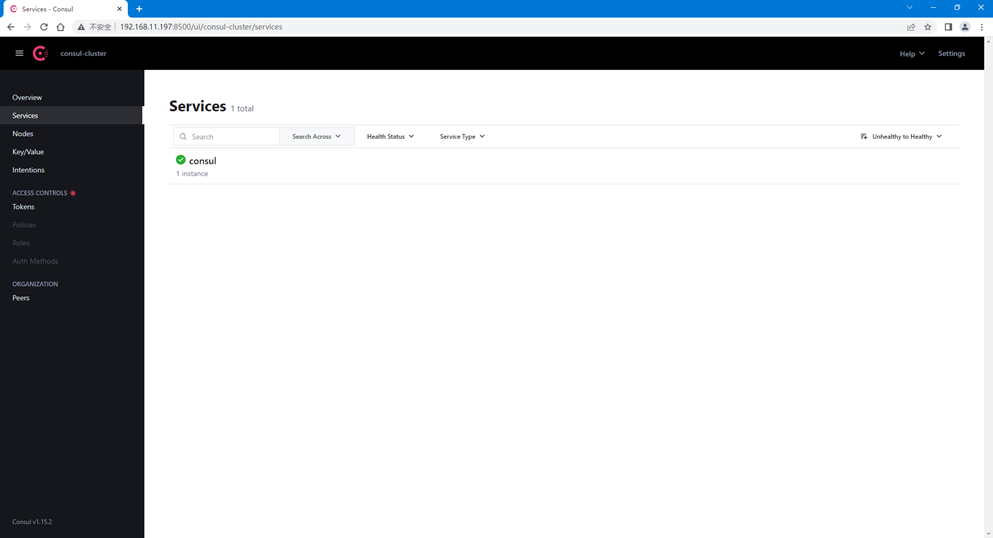
6、访问Consul
# 浏览器访问http://192.168.11.197:8500/,如下图所示
7、通过consul的API数据写入数据
[root@localhost ~]# curl -X PUT -d '{
    "id": "node3",
    "name": "node3",
    "address": "192.168.11.199",
    "port": 9100,
    "tags": [
        "node-exporter"
    ],
    "checks": [
        {
            "http": "http://192.168.11.199:9100/",
            "interval": "5s"
        }
    ]
}' http://192.168.11.197:8500/v1/agent/service/register
8、验证数据
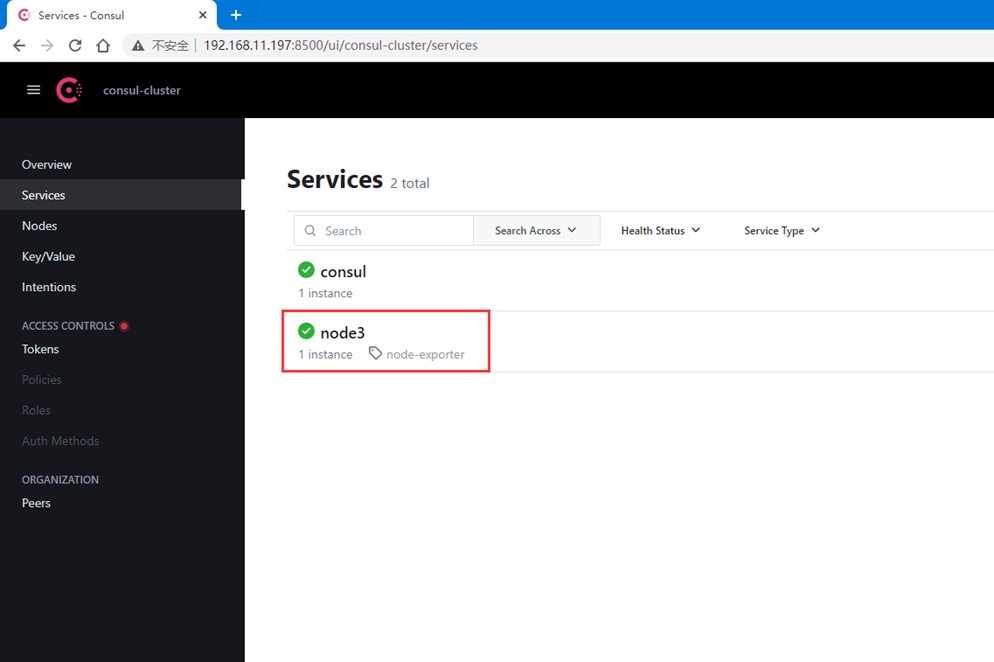
9、配置prometheus到consul的服务发现
[root@node3 ~]# vim /usr/local/prometheus/prometheus.yml
# 添加以下内容
scrape_configs:
  - job_name: "consul"  # 定义自动发现采集任务名称
    honor_labels: true
    metrics_path: /metrics
    scheme: http
    consul_sd_configs:
       - server: 192.168.11.197:8500
         services: []
    relabel_configs:
      - source_labels: ['__meta_consul_tags']
        target_label: 'product'
      - source_labels: ['__meta_consul_dc']
        target_label: 'idc'
      - source_labels: ['__meta_consul_service']
        regex: "consul"
        action: drop
10、Prometheus热加载
[root@node3 ~]# curl -X POST http://localhost:9090/-/reload
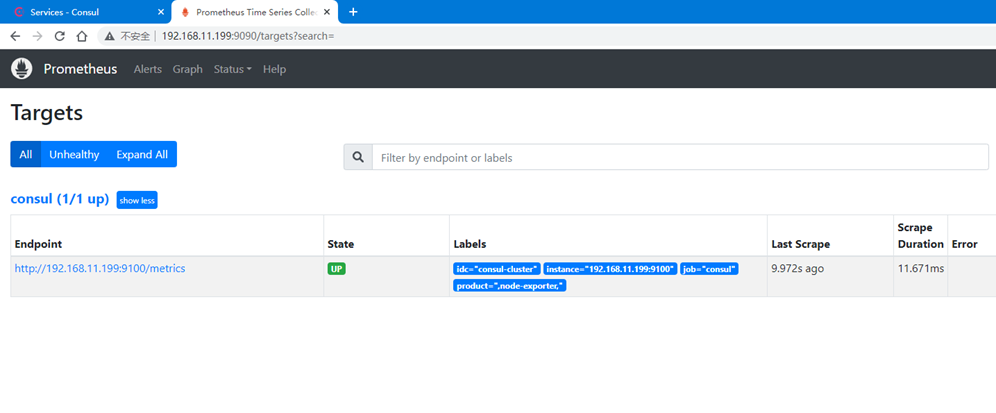
11、查看Prometheus
12、再次通过consul的API数据写入数据
[root@localhost ~]# curl -X PUT -d '{
    "id": "node2",
    "name": "node2",
    "address": "192.168.11.198",
    "port": 9100,
    "tags": [
        "node-exporter"
    ],
    "checks": [
        {
            "http": "http://192.168.11.198:9100/",
            "interval": "5s"
        }
    ]
}' http://192.168.11.197:8500/v1/agent/service/register
[root@localhost ~]# curl -X PUT -d '{
    "id": "node1",
    "name": "node1",
    "address": "192.168.11.197",
    "port": 9100,
    "tags": [
        "node-exporter"
    ],
    "checks": [
        {
            "http": "http://192.168.11.197:9100/",
            "interval": "5s"
        }
    ]
}' http://192.168.11.197:8500/v1/agent/service/register
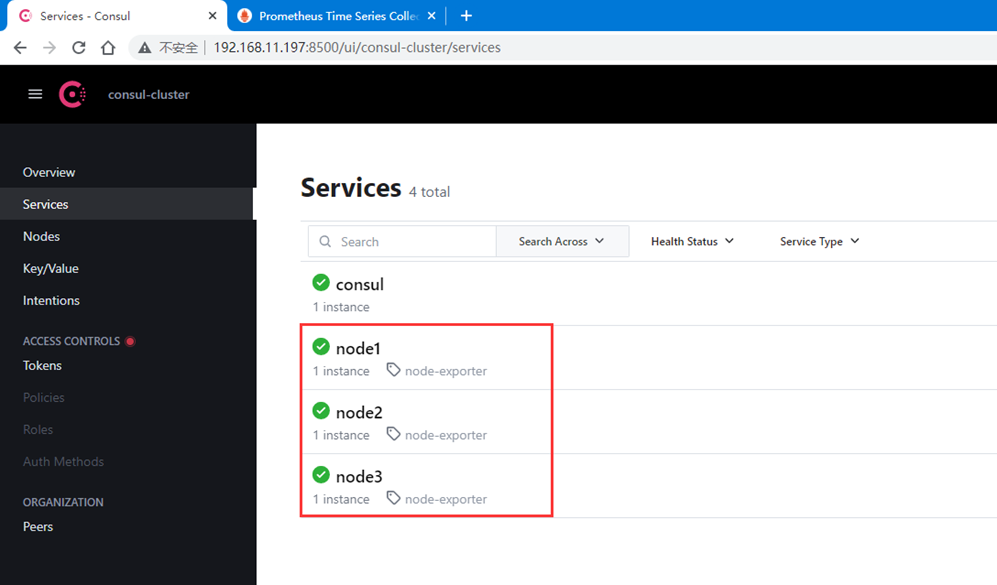
13、再次查看Consul
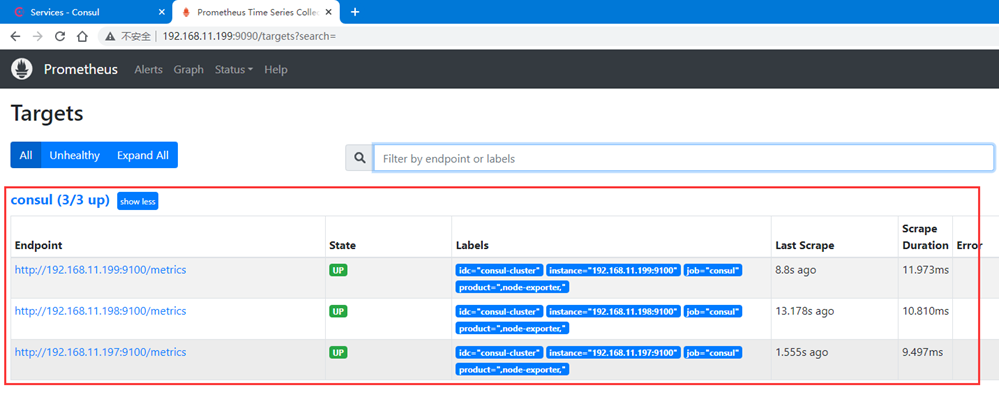
14、再次查看Prometheus
更多服务发现配置请查阅官网:https://prometheus.io/docs/prometheus/2.37/configuration/configuration/
若文章图片、下载链接等信息出错,请在评论区留言反馈,博主将第一时间更新!如本文“对您有用”,欢迎随意打赏,谢谢!


评论