
一、Blackbox_exporter应用场景
blackbox_exporter是Prometheus官方提供的exporter之一,可以提供 HTTP、HTTPS、DNS、TCP以及ICMP的方式对网络进行探测。
1)HTTP 测试
定义 Request Header信息
判断 Http status / Http Respones Header / Http Body内容
2)TCP 测试
业务组件端口状态监听
应用层协议定义与监听
3)ICMP 测试
主机探活机制
4)POST 测试
接口联通性
5)SSL证书过期时间
二、Blackbox_exporter安装
下载地址:https://prometheus.io/download/
1、下载安装包
[root@k8s-master ~]# wget https://github.com/prometheus/blackbox_exporter/releases/download/v0.22.0/blackbox_exporter-0.22.0.linux-amd64.tar.gz
2、解压并重命名
[root@k8s-master ~]# tar xf blackbox_exporter-0.22.0.linux-amd64.tar.gz
[root@k8s-master ~]# mv blackbox_exporter-0.22.0.linux-amd64 /usr/local/blackbox_exporter
3、授权
[root@k8s-master ~]# chown -R root.root /usr/local/blackbox_exporter
4、使用systemd进行管理blackbox_exporter服务
[root@k8s-master ~]# cat >/etc/systemd/system/blackbox_exporter.service <<EOF
[Unit]
Description=Blackbox Exporter
Wants=network-online.target
After=network-online.target
[Service]
User=root
ExecStart=/usr/local/blackbox_exporter/blackbox_exporter --config.file=/usr/local/blackbox_exporter/blackbox.yml
Restart=on-failure
[Install]
WantedBy=default.target
EOF
5、添加开机自启动
[root@k8s-master ~]# systemctl daemon-reload
[root@k8s-master ~]# systemctl enable blackbox_exporter
Created symlink from /etc/systemd/system/default.target.wants/blackbox_exporter.service to /etc/systemd/system/blackbox_exporter.service.
6、启动Blackbox_exporter
[root@k8s-master ~]# systemctl start blackbox_exporter
三、Prometheus安装
1、下载安装包
[root@k8s-master ~]# wget https://github.com/prometheus/prometheus/releases/download/v2.40.2/prometheus-2.40.2.linux-amd64.tar.gz
2、解压并重命名
[root@k8s-master ~]# tar xf prometheus-2.40.2.linux-amd64.tar.gz
[root@k8s-master ~]# mv prometheus-2.40.2.linux-amd64 /usr/local/prometheus
3、授权
[root@k8s-master ~]# chown -R root.root /usr/local/prometheus
[root@k8s-master ~]# cat >/etc/systemd/system/prometheus.service <<EOF
[Unit]
Description=prometheus
Documentation=https://prometheus.io/docs/introduction/overview
Wants=network-online.target
After=network.target
[Service]
Type=simple
User=root
ExecStart=/usr/local/prometheus/prometheus --config.file=/usr/local/prometheus/prometheus.yml --web.enable-lifecycle --storage.tsdb.path=/usr/local/prometheus/data
Restart=on-failure
[Install]
WantedBy=multi-user.target
EOF
5、添加开机自启动
[root@k8s-master ~]# systemctl daemon-reload
[root@k8s-master ~]# systemctl enable prometheus
Created symlink from /etc/systemd/system/multi-user.target.wants/prometheus.service to /etc/systemd/system/prometheus.service.
6、启动Blackbox_exporter
[root@k8s-master ~]# systemctl start prometheus
四、blackbox.yml配置文件详解
官方解释: https://github.com/prometheus/blackbox_exporter/blob/master/CONFIGURATION.md
1、默认配置
运行blackbox exporter时,需要用户提供探针的配置信息,这些配置信息可能是一些自定义的HTTP头信息,也可能是探测时需要的一些 TSL(秘钥证书) 配置,也可能是探针本身的验证行为.在 blackbox exporter每一个探针配置称为一个 module,并且以YAML配置文件的形式提供给blackbox exporter
每一个module主要包含以下配置内容:探针类型(prober),验证访问超时时间(timeout),以及当前探针的具体配置项
# 探针类型: http https tcp dns icmp
prober: <prober_string> #必选
# 超时时间:
[timeout: <duration>] #默认单位秒
# 探针的详细配置,最多只能配置其中一个
[ http: <http_probe> ]
[ tcp: <tcp_probe> ]
[ dns: <dns_probe> ]
[ icmp: <icmp_probe> ]
# 此探针接受的状态代码。默认为2xx。
[ valid_status_codes: <int>, ... | default = 2xx ]
# 此探针接受的HTTP版本.
[ valid_http_versions: <string>, ... ]
#探针将使用的HTTP方法。
[ method: <string> | default = "GET" ]
# 为探针设置的HTTP标头。
headers:
[ <string>: <string> ... ]
# 探针是否将遵循任何重定向
[ no_follow_redirects: <boolean> | default = false ]
# 如果存在SSL,则探测失败。
[ fail_if_ssl: <boolean> | default = false ]
# 如果不存在SSL,则探测失败。
[ fail_if_not_ssl: <boolean> | default = false ]
# 如果响应主体与正则表达式匹配,则探测失败。
fail_if_body_matches_regexp:
[ - <regex>, ... ]
# 如果响应主体与正则表达式不匹配,则探测失败。
fail_if_body_not_matches_regexp:
[ - <regex>, ... ]
# 如果响应头与正则表达式匹配,则探测失败。 对于具有多个值的标头,如果*至少一个*匹配,则失败。
fail_if_header_matches:
[ - <http_header_match_spec>, ... ]
# 如果响应头与正则表达式不匹配,则探测失败。 对于具有多个值的标头,如果* none *不匹配,则失败。
fail_if_header_not_matches:
[ - <http_header_match_spec>, ... ]
# HTTP探针的TLS协议的配置。
tls_config:
[ <tls_config> ]
# 目标的HTTP基本身份验证凭据。
basic_auth:
[ username: <string> ]
[ password: <secret> ]
# 目标的承载令牌。
[ bearer_token: <secret> ]
# 目标的承载令牌文件
[ bearer_token_file: <filename> ]
# 用于连接到目标的HTTP代理服务器。
[ proxy_url: <string> ]
# HTTP探针的IP协议(ip4,ip6)
[ preferred_ip_protocol: <string> | default = "ip6" ]
[ ip_protocol_fallback: <boolean> | default = true ]
# 探针中使用的HTTP请求的主体。
body: [ <string> ]
<http_header_match_spec>
header: <string>,
regexp: <regex>,
[ allow_missing: <boolean> | default = false ]
五、常用几种应用场景
1、HTTP检测(监控网站状态)
1)blackbox配置
[root@k8s-master ~]# vim /usr/local/blackbox_exporter/blackbox.yml
modules:
  http_2xx:
    prober: http
    http:
      method: GET
  http_post_2xx:
    prober: http
    http:
      method: POST
2)Prometheus配置
[root@k8s-master ~]# vim /usr/local/prometheus/prometheus.yml
  - job_name: 'blackbox_http_2xx'
    metrics_path: /probe
    params:
      module: [http_2xx]
    static_configs:
      - targets:
        - https://www.baidu.com
        - https://www.yangxingzhen.com
    relabel_configs:
      - source_labels: [__address__]
        target_label: __param_target
      - source_labels: [__param_target]
        target_label: instance
      - target_label: __address__
        #blackbox exporter 所在节点
        replacement: 10.10.50.24:9115
这里针对每1个探针服务(如http_2xx)定义一个采集任务,并且直接将任务的采集目标定义为我们需要探测的站点。在采集样本数据之前通过relabel_configs对采集任务进行动态设置。
- 根据 Target 实例的地址,写入__param_target 标签中,__param_<name>形式的标签表示,在采集任务时会在请求目标地址中添加<name>参数,等同于 params 的设置
- 获取__param_target的值,并覆写到instance标签中;
- 覆写Target实例的__address__标签值为BlockBox Exporter实例的访问地址。
3)Prometheus热加载配置文件
[root@k8s-master ~]# curl -X POST http://10.10.50.24:9090/-/reload
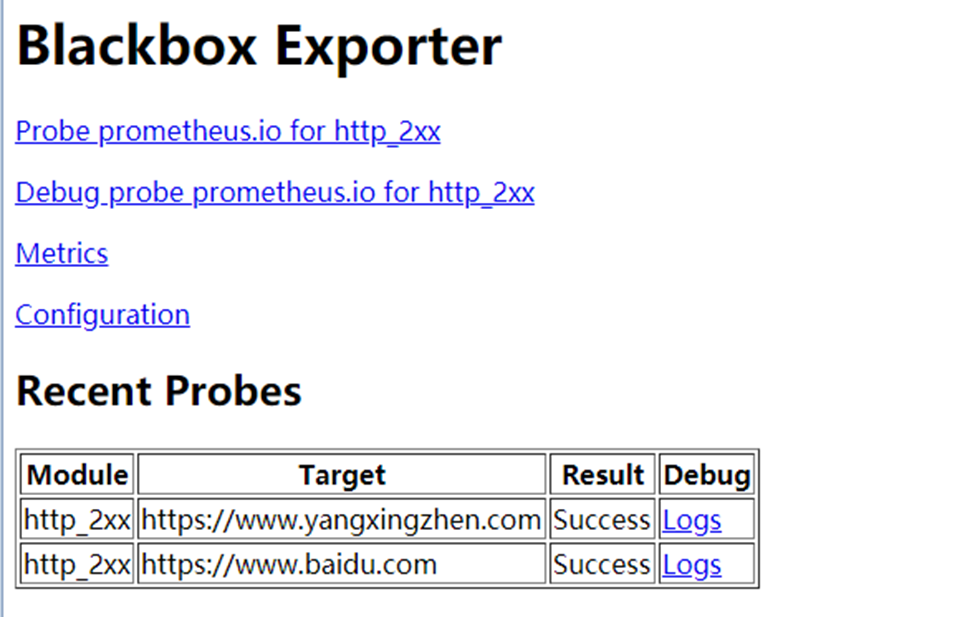
4)访问blackbox_exporter
# 浏览器输入http://10.10.50.24:9115
5)访问Prometheus的UI查看下targets
# 浏览器输入http://10.10.50.24:9090
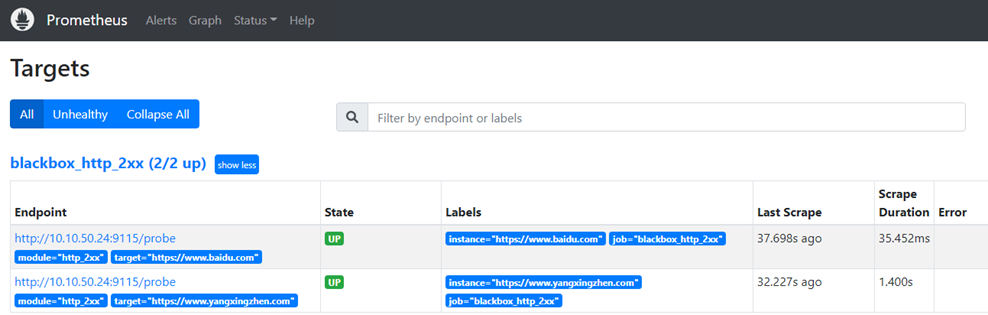
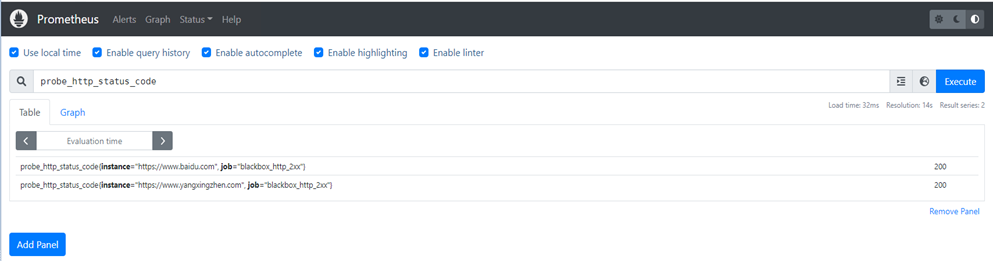
# 查询数据
6)自定义HTTP请求
HTTP服务通常会以不同的形式对外展现,有些可能就是一些简单的网页,而有些则可能是一些基于REST的API服务。 对于不同类型的HTTP的探测需要管理员能够对HTTP探针的行为进行更多的自定义设置,包括:HTTP请求方法、HTTP头信息、请求参数等。对于某些启用了安全认证的服务还需要能够对HTTP探测设置相应的Auth支持。对于HTTPS类型的服务还需要能够对证书进行自定义设置。
如下所示,这里通过method定义了探测时使用的请求方法,对于一些需要请求参数的服务,还可以通过headers定义相关的请求头信息,使用body定义请求内容:
http_post_2xx:
prober: http
timeout: 5s
http:
method: POST
headers:
Content-Type: application/json
body: '{}'
# 这里以WordPress为例,如下操作
[root@k8s-master ~]# vim /usr/local/blackbox_exporter/blackbox.yml
modules:
  http_2xx:
    prober: http
    http:
      method: GET
  http_post_2xx:
    prober: http
    timeout: 5s
    http:
      method: POST
      headers:
        Content-Type: application/json
      body: '{"user_login": "admin" "user_pass": "Aa123456"}'
[root@k8s-master ~]# systemctl restart blackbox_exporter
[root@k8s-master ~]# vim /usr/local/prometheus/prometheus.yml
# 添加以下内容
  - job_name: 'blackbox_http_post_2xx'
    metrics_path: /probe
    params:
      module: [http_post_2xx]
    static_configs:
      - targets:
        - http://10.10.50.24:30080/wp-login.php
    relabel_configs:
      - source_labels: [__address__]
        target_label: __param_target
      - source_labels: [__param_target]
        target_label: instance
      - target_label: __address__
        #blackbox exporter 所在节点
        replacement: 10.10.50.24:9115
保存配置并热加载配置文件
[root@k8s-master ~]# curl -X POST http://10.10.50.24:9090/-/reload
5)访问Prometheus的UI查看下targets
# 浏览器输入http://10.10.50.24:9090
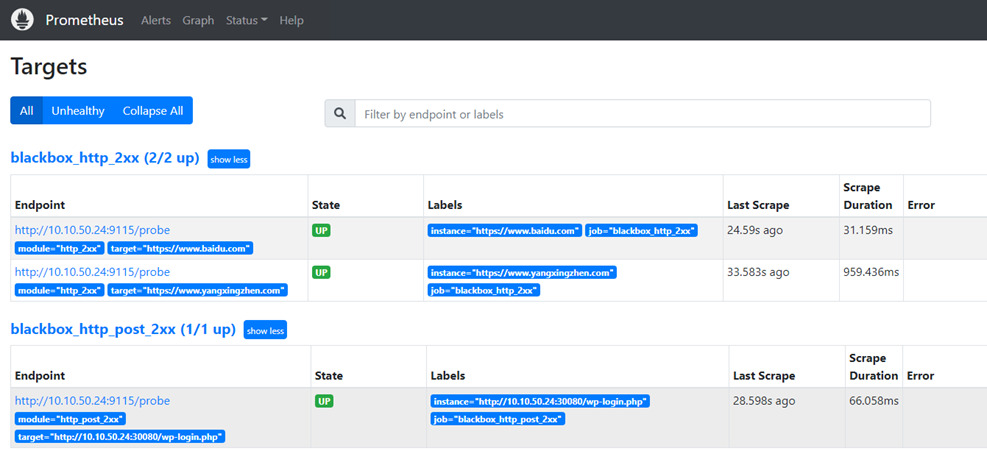
# 查询数据
6)如果HTTP服务启用了安全认证,Blockbox Exporter内置了对basic_auth的支持,可以直接设置相关的认证信息即可:
http_basic_auth_example:
prober: http
timeout: 5s
http:
method: POST
headers:
Host: "login.example.com"
basic_auth:
username: "username"
password: "mysecret"
对于使用了Bear Token的服务也可以通过bearer_token配置项直接指定令牌字符串,或者通过bearer_token_file指定令牌文件。
对于一些启用了HTTPS的服务,但是需要自定义证书的服务,可以通过tls_config指定相关的证书信息:
http_custom_ca_example:
prober: http
http:
method: GET
tls_config:
ca_file: "/certs/my_cert.crt"
7)自定义探针
在默认情况下HTTP探针只会对HTTP返回状态码进行校验,如果状态码为2XX(200 <= StatusCode < 300)则表示探测成功,并且探针返回的指标probe_success值为1。
如果用户需要指定HTTP返回状态码,或者对HTTP版本有特殊要求,如下所示,可以使用valid_http_versions和valid_status_codes进行定义:
http_2xx_example:
prober: http
timeout: 5s
http:
valid_http_versions: ["HTTP/1.1", "HTTP/2"]
valid_status_codes: [200,301,302]
默认情况下,Blockbox返回的样本数据中也会包含指标probe_http_ssl,用于表明当前探针是否使用了SSL:
# HELP probe_http_ssl Indicates if SSL was used for the final redirect
# TYPE probe_http_ssl gauge
probe_http_ssl 0
而如果用户对于HTTP服务是否启用SSL有强制的标准。则可以使用fail_if_ssl和fail_if_not_ssl进行配置。fail_if_ssl为true时,表示如果站点启用了SSL则探针失败,反之成功。fail_if_not_ssl刚好相反。
http_2xx_example:
prober: http
timeout: 5s
http:
valid_status_codes: []
method: GET
no_follow_redirects: false
fail_if_ssl: false
fail_if_not_ssl: false
除了基于HTTP状态码,HTTP协议版本以及是否启用SSL作为控制探针探测行为成功与否的标准以外,还可以匹配HTTP服务的响应内容。使用fail_if_matches_regexp和fail_if_not_matches_regexp用户可以定义一组正则表达式,用于验证HTTP返回内容是否符合或者不符合正则表达式的内容。
http_2xx_example:
prober: http
timeout: 5s
http:
method: GET
fail_if_matches_regexp:
- "Could not connect to database"
fail_if_not_matches_regexp:
- "Download the latest version here"
2、TCP(监控主机端口存活状态)
1)检测端口是否存活,在blackbox.yml 配置文件中使用的配置是tcp_connect模块
[root@k8s-master ~]# vim /usr/local/blackbox_exporter/blackbox.yml
# 添加以下内容
  tcp_connect:
    timeout: 5s
    prober: tcp
2)添加Prometheus配置
[root@k8s-master ~]# vim /usr/local/prometheus/prometheus.yml
# 添加以下内容
  - job_name: 'blackbox_check_ports'
    metrics_path: /probe
    params:
      module: [tcp_connect]
    static_configs:
      - targets:
        - 10.10.50.24:9115
        - 10.10.50.24:9090
    relabel_configs:
      - source_labels: [__address__]
        target_label: __param_target
      - source_labels: [__param_target]
        target_label: instance
      - target_label: __address__
        #blackbox exporter 所在节点
        replacement: 10.10.50.24:9115
3)Prometheus热加载配置文件
[root@k8s-master ~]# curl -X POST http://10.10.50.24:9090/-/reload
4)访问Prometheus的UI查看下targets
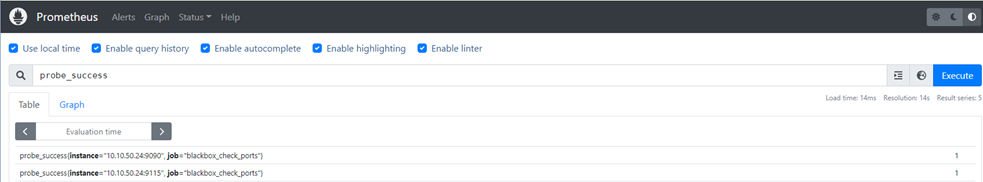
# 浏览器输入http://10.10.50.24:9090
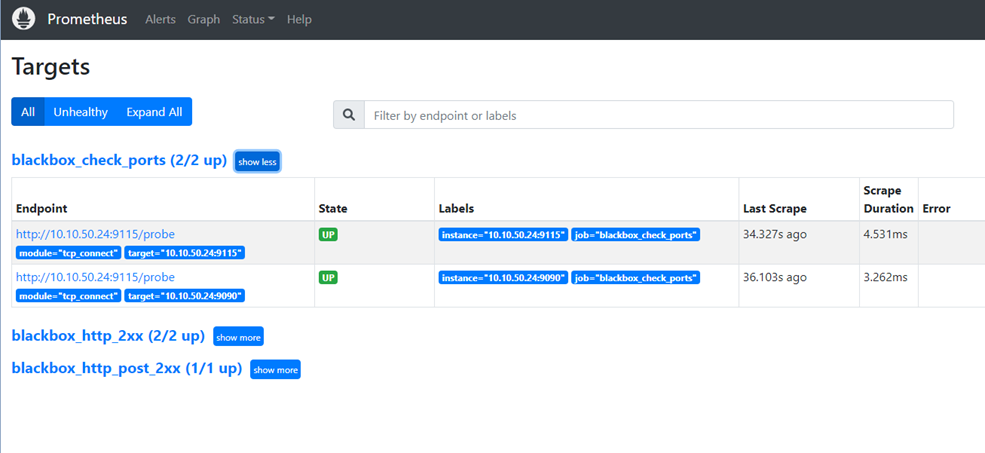
# 查询数据
3、ICMP 测试(主机探活)
1)通过 ping(icmp) 检测服务器的存活,在blackbox.yml使用的配置是icmp模块
[root@k8s-master ~]# vim /usr/local/blackbox_exporter/blackbox.yml
# 添加以下内容
  icmp:
    prober: icmp
    timeout: 5s
    icmp:
      ttl: 5
2)添加Prometheus配置
[root@k8s-master ~]# vim /usr/local/prometheus/prometheus.yml
# 添加以下内容
  - job_name: 'blackbox_check_hosts'
    metrics_path: /probe
    params:
      module: [icmp]
    static_configs:
      - targets:
        - 10.10.50.24
        - 10.10.50.23
    relabel_configs:
      - source_labels: [__address__]
        target_label: __param_target
      - source_labels: [__param_target]
        target_label: instance
      - target_label: __address__
        #blackbox exporter 所在节点
        replacement: 10.10.50.24:9115
3)Prometheus热加载配置文件
[root@k8s-master ~]# curl -X POST http://10.10.50.24:9090/-/reload
4)访问Prometheus的UI查看下targets
# 浏览器输入http://10.10.50.24:9090
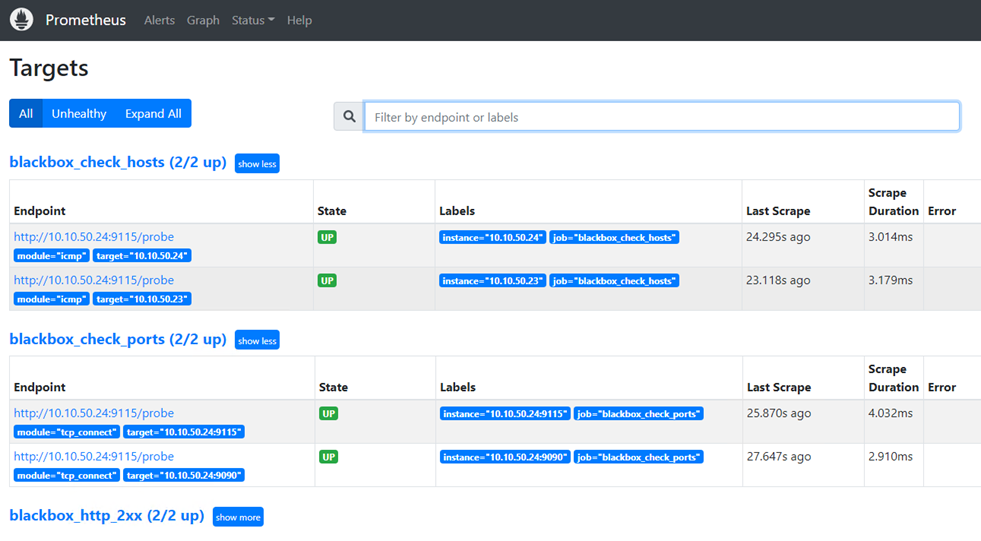
# 查询数据
4、检测SSL证书过期时间
1)检测SSL证书,在blackbox.yml配置文件中使用的配置是模块
[root@k8s-master ~]# vim /usr/local/blackbox_exporter/blackbox.yml
# 添加以下内容
  http_2xx:
    prober: http
    http:
      method: GET
      preferred_ip_protocol: "ipv4"
      valid_http_versions: ["HTTP/1.1", "HTTP/2"]
      valid_status_codes: [200,301,302,303]
2)添加Prometheus配置
[root@k8s-master ~]# vim /usr/local/prometheus/prometheus.yml
# 添加以下内容
  - job_name: 'blackbox_check_ssl'
    metrics_path: /probe
    params:
      module: [http_2xx]
    static_configs:
      - targets:
        - https://www.yangxingzhen.com
        - https://www.yangxingzhen.cn
    relabel_configs:
      - source_labels: [__address__]
        target_label: __param_target
      - source_labels: [__param_target]
        target_label: instance
      - target_label: __address__
        #blackbox exporter 所在节点
        replacement: 10.10.50.24:9115
3)Prometheus热加载配置文件
[root@k8s-master ~]# curl -X POST http://10.10.50.24:9090/-/reload
4)访问Prometheus的UI查看下targets
# 浏览器输入http://10.10.50.24:9090
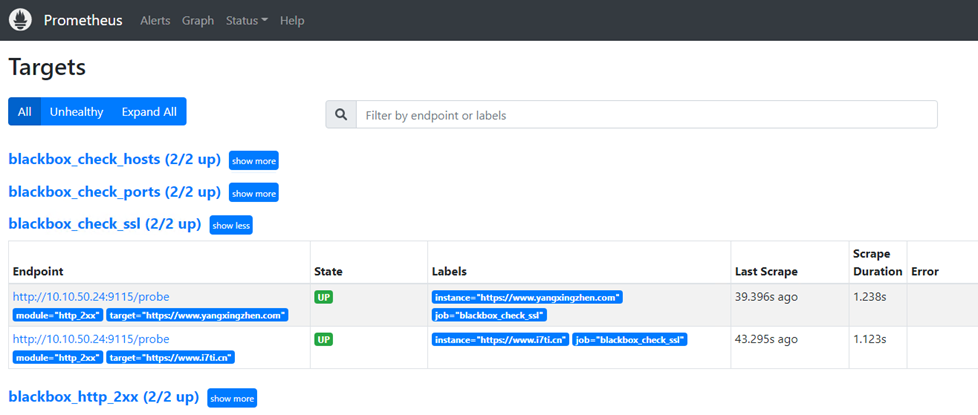
# 查询数据
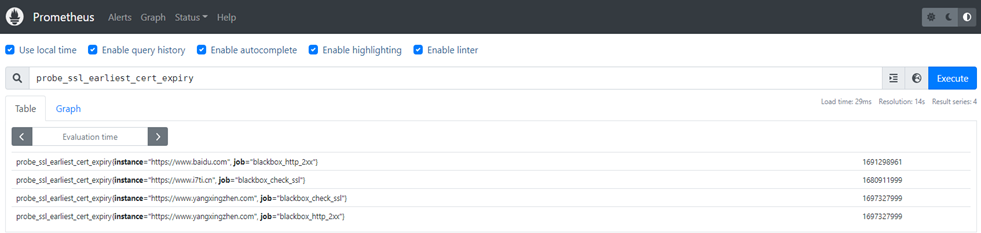
5)时间戳转换
# 这里以yangxingzhen.com的SSL证书为例,证书过期时间为2023年10月15日
[root@k8s-master ~]# date -d "@1697327999"
Sun Oct 15 07:59:59 CST 2023
5、相关告警规则
1)主机端口不通
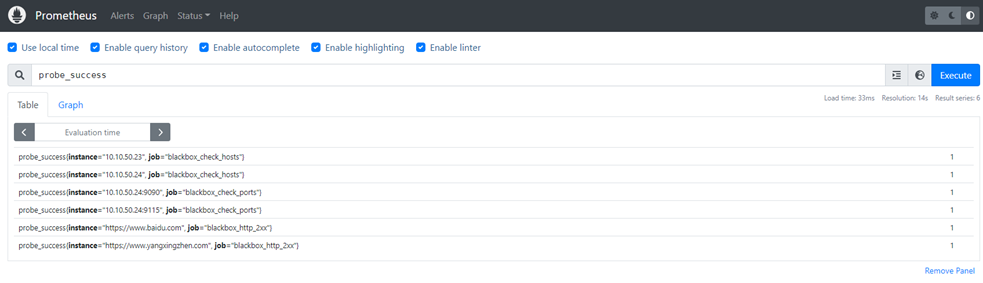
probe_success{job="blackbox_check_ports"} == 0
2)主机ping不通
probe_success{job="blackbox_check_hosts"} == 0
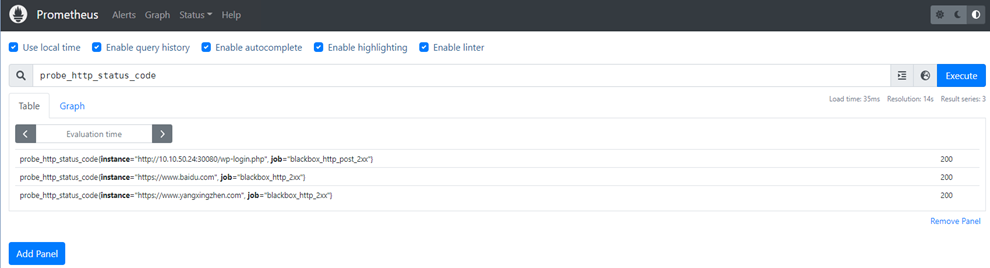
3)非200HTTP状态码
probe_http_status_code{job="blackbox_http_2xx"} != 200
4)SSL证书还有30天过期
probe_ssl_earliest_cert_expiry{job="blackbox_check_ssl"} - time() < 86400 * 30
若文章图片、下载链接等信息出错,请在评论区留言反馈,博主将第一时间更新!如本文“对您有用”,欢迎随意打赏,谢谢!


评论