
一、安装Alertmanager
prometheus报警配置需要用到alertmanager组件,这个组件可以到prometheus官网上进行下载。
官网:https://prometheus.io/download/
1、下载Alertmanager
[root@localhost ~]# wget https://github.com/prometheus/alertmanager/releases/download/v0.20.0/alertmanager-0.20.0.linux-amd64.tar.gz
[root@localhost ~]# tar xf alertmanager-0.20.0.linux-amd64.tar.gz
[root@localhost ~]# mv alertmanager-0.20.0.linux-amd64 /usr/local/alertmanager
2、创建启动文件
[root@localhost ~]# vim /usr/lib/systemd/system/alertmanager.service
[Unit]
Description=alertmanager
Documentation=https://github.com/prometheus/alertmanager
After=network.target
[Service]
Type=simple
User=root
ExecStart=/usr/local/alertmanager/alertmanager --config.file=/usr/local/alertmanager/alertmanager.yml
Restart=on-failure
[Install]
WantedBy=multi-user.target
3、配置alertmanager.yml文件
Alertmanager 安装目录下默认有 alertmanager.yml 配置文件,可以创建新的配置文件,在启动时指定即可。
[root@localhost ~]# cd /usr/local/alertmanager
[root@localhost alertmanager]# vim alertmanager.yml
global:
  resolve_timeout: 5m
  # 邮件配置
  smtp_smarthost: 'smtp.exmail.qq.com:25'
  smtp_from: 'service@yangxingzhen.com'
  smtp_auth_username: 'service@yangxingzhen.com'
  smtp_auth_password: '123456'
  smtp_require_tls: false
# route用来设置报警的分发策略
route:
  # 采用哪个标签来作为分组依据
  group_by: ['alertname']
  # 组告警等待时间。也就是告警产生后等待10s,如果有同组告警一起发出
  group_wait: 10s
  # 两组告警的间隔时间
  group_interval: 10s
  # 重复告警的间隔时间,减少相同邮件的发送频率
  repeat_interval: 5m
  # 设置默认接收人
  receiver: 'default-receiver'
  routes:   # 可以指定哪些组接手哪些消息
  - receiver: 'default-receiver'
    continue: true
    group_wait: 10s
receivers:
- name: 'default-receiver'
  email_configs:
  - to: 'xingzhen.yang@yangxingzhen.com'
    headers: { Subject: "[WARN] 报警邮件" }
- smtp_smarthost:是用于发送邮件的邮箱的 SMTP 服务器地址+端口;
- smtp_auth_password:是发送邮箱的授权码而不是登录密码;
- smtp_require_tls:不设置的话默认为 true,当为 true 时会有 starttls 错误,为了简单这里设置为 false;
- headers:为邮件标题;
4、配置Alertmanager报警规则
[root@localhost alertmanager]# mkdir -p /usr/local/prometheus/rules
[root@localhost alertmanager]# cd /usr/local/prometheus/rules
[root@localhost rules]# vim mysql.yml
groups:
- name: MySQL
  rules:
  - alert: MySQL Status # 告警名称
    expr: mysql_up == 0
    for: 5s # 满足告警条件持续时间多久后,才会发送告警
    annotations: # 解析项,详细解释告警信息
      summary: "{{$labels.instance}}: MySQL has stop !!!"
      value: "{{$value}}"
      alertname: "MySQL数据库停止运行"
      description: "检测MySQL数据库运行状态"
      message: 当前数据库实例{{$labels.instance}}已经停止运行,请及时处理
  - alert: MySQL Slave IO Thread Status # 告警名称
    expr: mysql_slave_status_slave_io_running == 0
    for: 5s # 满足告警条件持续时间多久后,才会发送告警
    annotations: # 解析项,详细解释告警信息
      summary: "{{$labels.instance}}: MySQL Slave IO Thread has stop !!!"
      value: "{{$value}}"
      alertname: "MySQL主从IO线程停止运行"
      description: "检测MySQL主从IO线程运行状态"
      message: 当前数据库实例{{$labels.instance}} IO线程已经停止运行,请及时处理
  - alert: MySQL Slave SQL Thread Status # 告警名称
    expr: mysql_slave_status_slave_sql_running == 0
    for: 5s # 满足告警条件持续时间多久后,才会发送告警
    annotations: # 解析项,详细解释告警信息
      summary: "{{$labels.instance}}: MySQL Slave SQL Thread has stop !!!"
      value: "{{$value}}"
      alertname: "MySQL主从SQL线程停止运行"
      description: "检测MySQL主从SQL线程运行状态"
      message: 当前数据库实例{{$labels.instance}} SQL线程已经停止运行,请及时处理
  - alert: MySQL Slave Delay Status # 告警名称
    expr: mysql_slave_status_sql_delay == 30
    for: 5s # 满足告警条件持续时间多久后,才会发送告警
    annotations: # 解析项,详细解释告警信息
      summary: "{{$labels.instance}}: MySQL Slave Delay has more than 30s !!!"
      value: "{{$value}}"
      alertname: "MySQL主从延时过大"
      description: "检测MySQL主从延时状态"
      message: 当前数据库实例{{$labels.instance}} 主从延时状态已经超过30s,请及时处理
在Prometheus.yml 中指定 mysql.yml 的路径
[root@localhost rules]# vim /usr/local/prometheus/prometheus.yml
global:
  scrape_interval:     15s # Set the scrape interval to every 15 seconds. Default is every 1 minute.
  evaluation_interval: 15s # Evaluate rules every 15 seconds. The default is every 1 minute.
  # scrape_timeout is set to the global default (10s).

# Alertmanager configuration
alerting:
  alertmanagers:
  - static_configs:
    - targets: ['localhost:9093']
      # - localhost:9093

# Load rules once and periodically evaluate them according to the global 'evaluation_interval'.
rule_files:
  - 'rules/*.yml'
  # - "first_rules.yml"
  # - "second_rules.yml"

# A scrape configuration containing exactly one endpoint to scrape:
# Here it's Prometheus itself.
scrape_configs:
  # The job name is added as a label `job=<job_name>` to any timeseries scraped from this config.
  - job_name: 'prometheus'
    # metrics_path defaults to '/metrics'
    # scheme defaults to 'http'.

    static_configs:
    - targets: ['localhost:9100']
5、重启 Prometheus 服务
[root@localhost rules]# systemctl restart prometheus
6、启动 Alertmanager
[root@localhost rules]# systemctl daemon-reload
[root@localhost rules]# systemctl start alertmanager
7、验证邮件报警
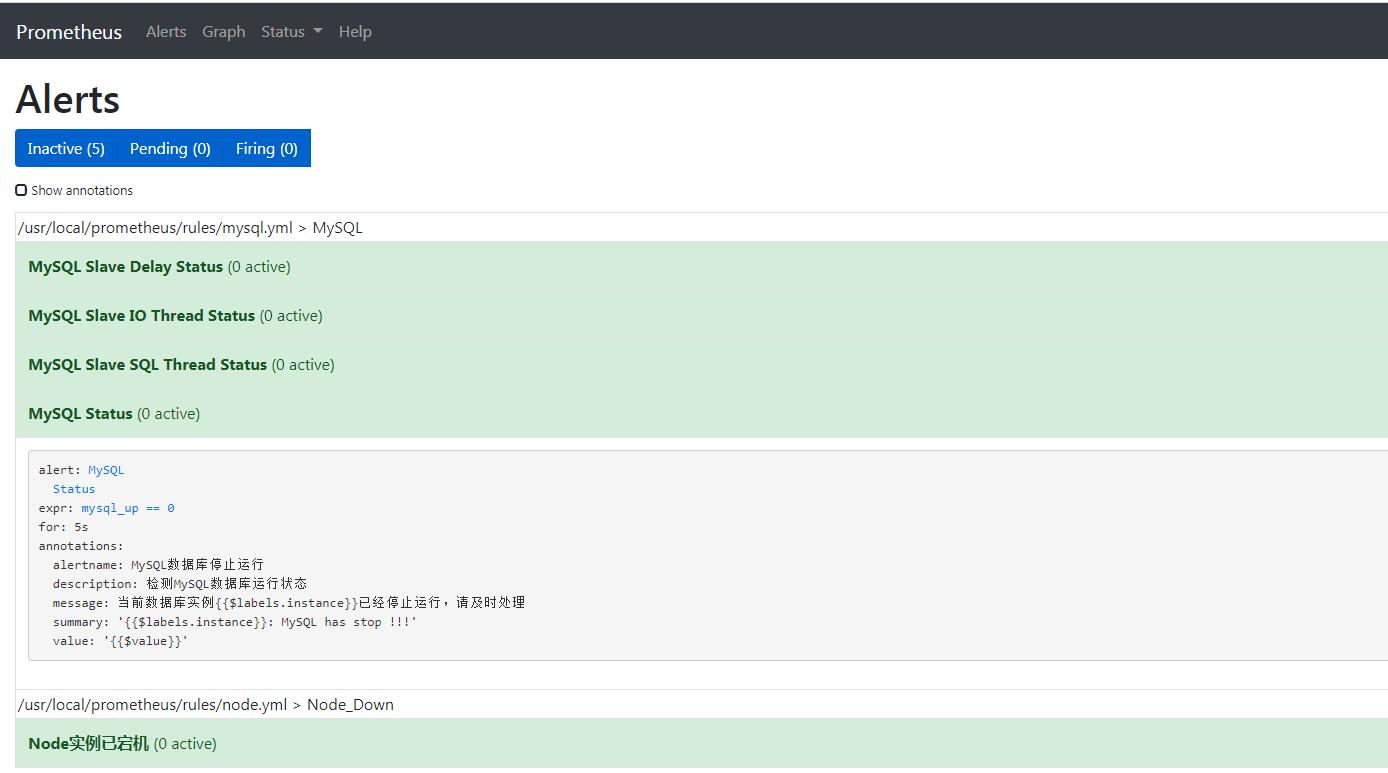
登陆prometheus的web页面,查看报警信息。
浏览器输入Prometheus_IP:9090,可以看到各个报警项的状态
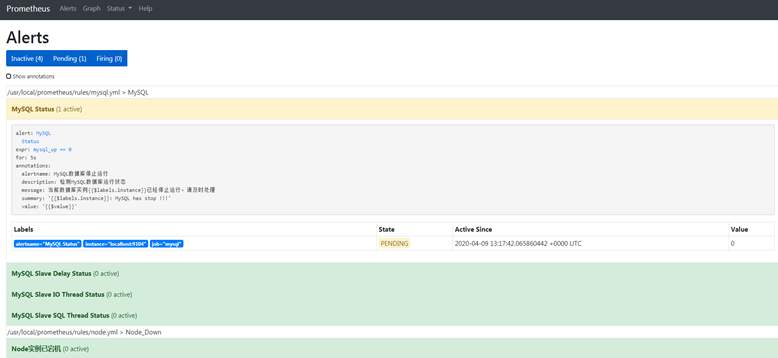
然后停止Mysql服务,然后再看效果。
[root@localhost rules]# systemctl stop mysqld
prometheus界面的alert可以看到告警状态。
- 绿色表示正常。
- 红色状态为PENDING表示alerts还没有发送至Alertmanager,因为rules里面配置了for: 5s。
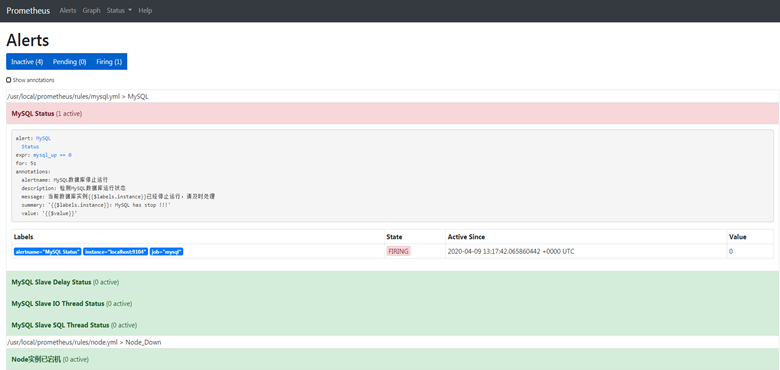
5秒后状态由PENDING变为FIRING,此时Prometheus才将告警发给alertmanager,在Alertmanager中可以看到有一个alert。
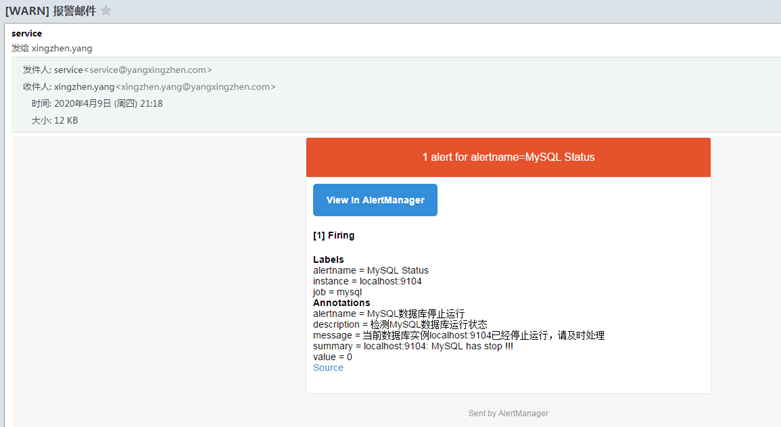
接着邮箱会收到邮件:
可参考示例:
https://github.com/prometheus/mysqld_exporter/blob/master/example.rules
若文章图片、下载链接等信息出错,请在评论区留言反馈,博主将第一时间更新!如本文“对您有用”,欢迎随意打赏,谢谢!


评论